


| Duration | 0:00 | Takeoff Distance | 0 |
| Height: | metres |
| Climb: | m/sec |
| Speed: | km/h |
| Distance: | km |
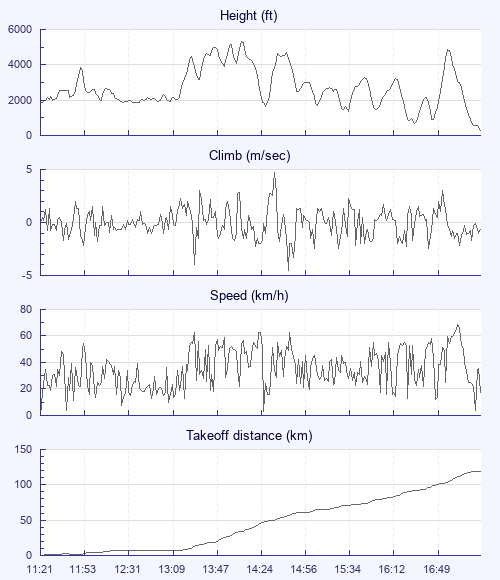
| Height - GPS data | |
| Maximum Height [14:12:02] |
5305 ft |
| Lowest Save [16:36:38] |
705 ft |
| Takeoff Height [11:21:14] |
1821 ft |
| Landing Height [17:28:58] |
262 ft |
| Total Ascent | 28182 ft |
| Height Gain | |
| Above Takeoff | 3484 ft |
| Maximum | 4213 ft |
| Low Point as Lowest Save |
705 ft |
| High Point [17:05:34] |
4918 ft |
| Units | |
| Climb - Pressure data | |
| Maximum Climb [14:37:10] |
4.7 m/s |
| Minimum Climb [14:48:40] |
-4.5 m/s |
| Units | |
| Speed | |
| Maximum Speed [17:13:52] |
68.4 km/h |
| Average Speed around course |
21.0 km/h |
| Average Speed over track length |
35.9 km/h |
| Units | |
| Tracklog | |
| Flight Duration | 6hrs 7mins |
| Track Points | 7224 |
| Recording Interval | 3 secs |
| Statistics Interval | 6 secs |
| Track Length | 220.0 km |
| Units | |
| Flight instrument - reported as | |
| 5020 SN05549 SW1.18 |
| Height: | |
| Speed: | |
| Climb: | |
| Distance: |
| Main Map: |
| First Tab: |