


| Duration | 0:00 | Takeoff Distance | 0 |
| Height: | metres |
| Climb: | m/sec |
| Speed: | km/h |
| Distance: | km |
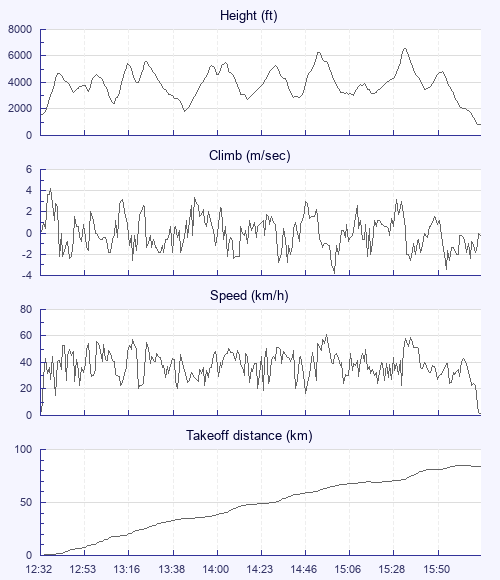
| Height - GPS data | |
| Maximum Height [15:40:19] |
6591 ft |
| Lowest Save [13:46:19] |
1785 ft |
| Takeoff Height [12:32:04] |
1565 ft |
| Landing Height [16:15:49] |
853 ft |
| Total Ascent | 28225 ft |
| Height Gain | |
| Above Takeoff | 5026 ft |
| Maximum | 5049 ft |
| Low Point [12:32:19] |
1542 ft |
| High Point as Maximum Height |
6591 ft |
| Units | |
| Climb - GPS data | |
| Maximum Climb [12:36:04] |
4.2 m/s |
| Minimum Climb [15:04:19] |
-3.8 m/s |
| Units | |
| Speed | |
| Maximum Speed [15:00:44] |
61.2 km/h |
| Average Speed around course |
24.4 km/h |
| Average Speed over track length |
37.9 km/h |
| Units | |
| Tracklog | |
| Flight Duration | 3hrs 43mins |
| Track Points | 2686 |
| Recording Interval | 5 secs |
| Statistics Interval | 5 secs |
| Track Length | 141.2 km |
| Units | |
| Flight instrument - reported as | |
| GPSMap60CX Software Version 3.70 |
| Height: | |
| Speed: | |
| Climb: | |
| Distance: |
| Main Map: |
| First Tab: |