


| Duration | 0:00 | Takeoff Distance | 0 |
| Height: | metres |
| Climb: | m/sec |
| Speed: | km/h |
| Distance: | km |
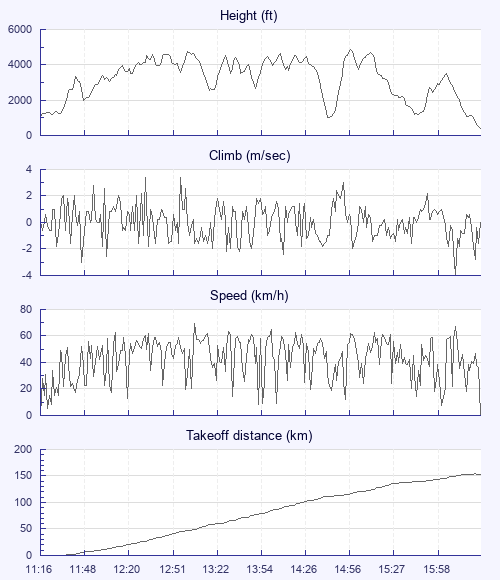
| Height - GPS data | |
| Maximum Height [15:05:42] |
4888 ft |
| Lowest Save [14:50:52] |
994 ft |
| Takeoff Height [11:16:50] |
1089 ft |
| Landing Height [16:33:54] |
400 ft |
| Total Ascent | 29747 ft |
| Height Gain | |
| Above Takeoff | 3799 ft |
| Maximum | 3894 ft |
| Low Point as Lowest Save |
994 ft |
| High Point as Maximum Height |
4888 ft |
| Units | |
| Climb - Pressure data | |
| Maximum Climb [12:34:17] |
3.4 m/s |
| Minimum Climb [16:20:14] |
-4.0 m/s |
| Units | |
| Speed | |
| Maximum Speed [13:10:47] |
69.1 km/h |
| Average Speed around course |
31.3 km/h |
| Average Speed over track length |
42.2 km/h |
| Units | |
| Tracklog | |
| Flight Duration | 5hrs 17mins |
| Track Points | 3790 |
| Recording Interval | 5 secs |
| Statistics Interval | 5 secs |
| Track Length | 222.8 km |
| Units | |
| Flight instrument - reported as | |
| COMPEO+ SN02523 SW3.37 |
| Height: | |
| Speed: | |
| Climb: | |
| Distance: |
| Main Map: |
| First Tab: |