Xc Title
User:Guest
Ozone advert
David Warren  All flights
National League 2015
Flight type image
Turnpoint Flight on a Paraglider
Club
Avon
Glider
Skywalk Chili 3
Date
7th June 2015
Start
11:55
Finish
16:38
Duration
4hrs 43mins
Takeoff
Leckhampton
Landing
Nr Winterborne Monkton
Coords
Takeoff
51.86500, -2.06695
Start
51.86667, -2.05933
TP1
51.66858, -2.12283
TP2
51.42803, -2.04820
TP3
51.20208, -2.30500
Finish
50.69445, -2.45037
Landing
50.69588, -2.44953
Distances and Score
Leg 1
22.47k
Leg 2
27.26k
Leg 3
30.86k
Leg 4
57.39k
Total
137.98k
Score
138.0
Open Distance
Total
133.2k
Filename
Use full pilot name
Download
Validated
Yes
Flight map
Notes

This map gives an overview of the flight, using the turnpoints to plot the track.

Use the for a detailed map and flight track.

Duration 0:00   Takeoff Distance 0
Controls
To animate the flight: click a point on the track, use the slider, or click the Play button.
slider
slider
Speed
Speed
Slower
Faster
Track color
No data
Highlights
Track data
Time: No data
Height:
Climb:
Speed:
Interval:
Units
Height: metres
Climb: m/sec
Speed: km/h
Distance: km
chart
Notes

Climb and Speed averaged over 4 second intervals.

These values may be lower than those shown by a flight instrument, which has access to continuous raw data.

Red values indicate suspect data, because the tracklog contains invalid points.

Metric units are used for all chart data, except for Height which is shown in feet.

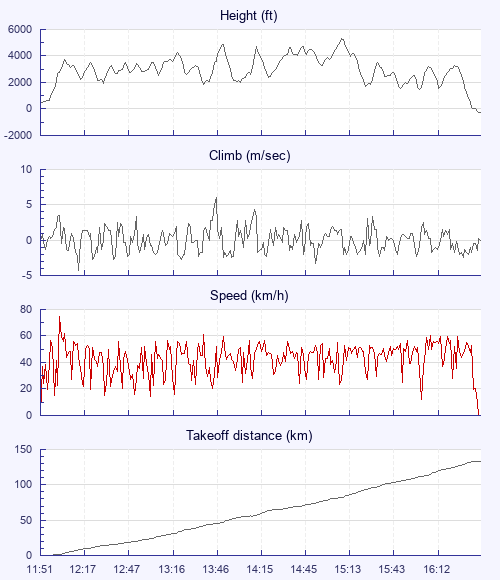
Height   -   Pressure data
Maximum Height
[15:11:35]
5302 ft
Lowest Save
[16:04:22]
1483 ft
Takeoff Height
[11:51:13]
394 ft
Landing Height
[16:40:53]
-266 ft
Total Ascent 38061 ft
Height Gain
Above Takeoff 4908 ft
Maximum 4918 ft
Low Point
[11:51:36]
384 ft
High Point
as Maximum Height
5302 ft
Units
Climb   -   Pressure data
Maximum Climb
[13:46:37]
6.0 m/s
Minimum Climb
[12:14:07]
-4.3 m/s
Units
Speed
Maximum Speed
[12:02:27]
74.7 km/h
Average Speed
around course
29.2 km/h
Average Speed
over track length
42.6 km/h
Units
Tracklog
Flight Duration 4hrs 49mins
Track Points 17381
Recording Interval 1 secs
Statistics Interval 4 secs
Track Length 205.5 km
Invalid Positions
[< 1%]
23
Units
Flight instrument   -   reported as
XC Trainer V1.4-09
Notes

Climb and Speed averaged over 4 second intervals.

These values may be lower than those shown by a flight instrument, which has access to continuous raw data.

Red values indicate suspect data, because the tracklog contains invalid points.

Average Speed around course is measured from Start to Finish points.

Track Length is the cumulative distance between track points from Takeoff to Landing.

You can change the default units displayed - see the Options page.

Use this page to set various display Options. You can choose which units are used to display flight data, which map to show when the starts and which tab to show each time you view a flight.
Units settings

Metric units are used by default for the Statistics and XC Player pages, except for Height data which is shown in feet. You can choose your own custom settings here.

Height:
Speed:
Climb:
Distance:
  Use default
XC Player settings

When the XC Player starts, the track data is shown on the Hybrid map. You can choose a different map here.

Main Map:
  Use default
Tab settings

The first tab shown when you view a flight is the Flight Map. You can choose a different tab here.

First Tab:
  Use default
Notes

This page uses cookies to save your settings for future visits.

If you have disabled cookies for this site then any changes you make will not be saved.