


| Duration | 0:00 | Takeoff Distance | 0 |
| Height: | metres |
| Climb: | m/sec |
| Speed: | km/h |
| Distance: | km |
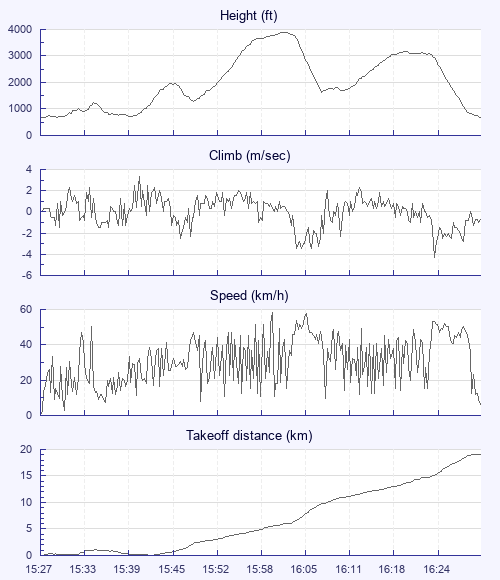
| Height - GPS data | |
| Maximum Height [16:03:30] |
3891 ft |
| Lowest Save [15:40:21] |
709 ft |
| Takeoff Height [15:27:08] |
679 ft |
| Landing Height [16:32:25] |
686 ft |
| Total Ascent | 7631 ft |
| Height Gain | |
| Above Takeoff | 3212 ft |
| Maximum | 3225 ft |
| Low Point [15:27:37] |
666 ft |
| High Point as Maximum Height |
3891 ft |
| Units | |
| Climb - Pressure data | |
| Maximum Climb [15:41:04] |
3.3 m/s |
| Minimum Climb [16:26:08] |
-4.3 m/s |
| Units | |
| Speed | |
| Maximum Speed [16:01:36] |
58.5 km/h |
| Average Speed around course |
21.4 km/h |
| Average Speed over track length |
31.8 km/h |
| Units | |
| Tracklog | |
| Flight Duration | 1hr 5mins |
| Track Points | 3918 |
| Recording Interval | 1 secs |
| Statistics Interval | 4 secs |
| Track Length | 34.6 km |
| Units | |
| Flight instrument | |
| Type | Oudie 3 |
| Model | Not Set |
| Firmware | 6.11.001 |
| Height: | |
| Speed: | |
| Climb: | |
| Distance: |
| Main Map: |
| First Tab: |