Xc Title
User:Guest
Cloudbase Paragliding advert
Gary Stenhouse  All flights
National League 2015
Flight type image
Turnpoint Flight on a Paraglider
Club
Northumbria
Glider
Ozone Enzo 2
Date
3rd July 2015
Start
13:49
Finish
15:23
Duration
1hr 34mins
Takeoff
semmer Water
Landing
Nr Crosby Ravensworth
Coords
Takeoff
54.28858, -2.13882
Start
54.28845, -2.13830
TP1
54.28532, -2.15508
TP2
54.34283, -2.17342
TP3
54.45725, -2.38273
Finish
54.51568, -2.59210
Landing
54.51672, -2.58850
Distances and Score
Leg 1
1.15k
Leg 2
6.51k
Leg 3
18.63k
Leg 4
15.05k
Total
41.34k
Score
41.3
Open Distance
Total
38.9k
Filename
Use full pilot name
Download
Validated
Yes
Flight map
Notes

This map gives an overview of the flight, using the turnpoints to plot the track.

Use the for a detailed map and flight track.

Duration 0:00   Takeoff Distance 0
Controls
To animate the flight: click a point on the track, use the slider, or click the Play button.
slider
slider
Speed
Speed
Slower
Faster
Track color
No data
Highlights
Track data
Time: No data
Height:
Climb:
Speed:
Interval:
Units
Height: metres
Climb: m/sec
Speed: km/h
Distance: km
chart
Notes

Climb and Speed averaged over 4 second intervals.

These values may be lower than those shown by a flight instrument, which has access to continuous raw data.

Red values indicate suspect data, because the tracklog contains invalid points.

Metric units are used for all chart data, except for Height which is shown in feet.

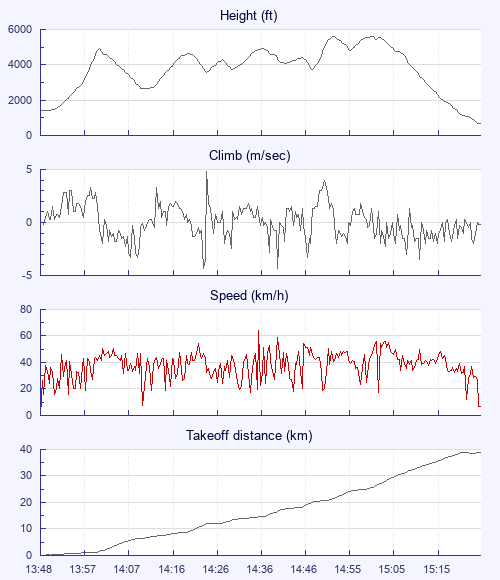
Height   -   Pressure data
Maximum Height
[14:53:48]
5630 ft
Lowest Save
[14:10:38]
2657 ft
Takeoff Height
[13:48:34]
1368 ft
Landing Height
[15:26:38]
656 ft
Total Ascent 12274 ft
Height Gain
Above Takeoff 4262 ft
Units
Climb   -   Pressure data
Maximum Climb
[14:25:20]
4.8 m/s
Minimum Climb
[14:24:36]
-4.3 m/s
Units
Speed
Maximum Speed
[14:36:55]
64.5 km/h
Average Speed
around course
26.3 km/h
Average Speed
over track length
38.1 km/h
Units
Tracklog
Flight Duration 1hr 38mins
Track Points 5882
Recording Interval 1 secs
Statistics Interval 4 secs
Track Length 62.3 km
Invalid Positions
[< 1%]
2
Units
Notes

Climb and Speed averaged over 4 second intervals.

These values may be lower than those shown by a flight instrument, which has access to continuous raw data.

Red values indicate suspect data, because the tracklog contains invalid points.

Average Speed around course is measured from Start to Finish points.

Track Length is the cumulative distance between track points from Takeoff to Landing.

You can change the default units displayed - see the Options page.

Use this page to set various display Options. You can choose which units are used to display flight data, which map to show when the starts and which tab to show each time you view a flight.
Units settings

Metric units are used by default for the Statistics and XC Player pages, except for Height data which is shown in feet. You can choose your own custom settings here.

Height:
Speed:
Climb:
Distance:
  Use default
XC Player settings

When the XC Player starts, the track data is shown on the Hybrid map. You can choose a different map here.

Main Map:
  Use default
Tab settings

The first tab shown when you view a flight is the Flight Map. You can choose a different tab here.

First Tab:
  Use default
Notes

This page uses cookies to save your settings for future visits.

If you have disabled cookies for this site then any changes you make will not be saved.