


| Duration | 0:00 | Takeoff Distance | 0 |
| Height: | metres |
| Climb: | m/sec |
| Speed: | km/h |
| Distance: | km |
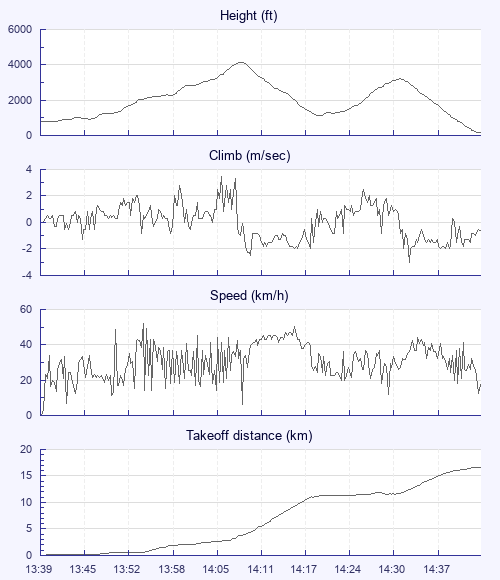
| Height - GPS data | |
| Maximum Height [14:08:57] |
4131 ft |
| Lowest Save [14:20:43] |
1135 ft |
| Takeoff Height [13:39:51] |
807 ft |
| Landing Height [14:43:48] |
177 ft |
| Total Ascent | 6194 ft |
| Height Gain | |
| Above Takeoff | 3323 ft |
| Maximum | 3353 ft |
| Low Point [13:41:47] |
778 ft |
| High Point as Maximum Height |
4131 ft |
| Units | |
| Climb - Pressure data | |
| Maximum Climb [14:06:07] |
3.5 m/s |
| Minimum Climb [14:33:43] |
-3.0 m/s |
| Units | |
| Speed | |
| Maximum Speed [13:54:19] |
52.2 km/h |
| Average Speed around course |
18.5 km/h |
| Average Speed over track length |
31.4 km/h |
| Units | |
| Tracklog | |
| Flight Duration | 1hr 3mins |
| Track Points | 3838 |
| Recording Interval | 1 secs |
| Statistics Interval | 4 secs |
| Track Length | 33.5 km |
| Units | |
| Flight instrument | |
| Type | Oudie 3 |
| Model | Not Set |
| Firmware | 6.11.001 |
| Height: | |
| Speed: | |
| Climb: | |
| Distance: |
| Main Map: |
| First Tab: |