


| Duration | 0:00 | Takeoff Distance | 0 |
| Height: | metres |
| Climb: | m/sec |
| Speed: | km/h |
| Distance: | km |
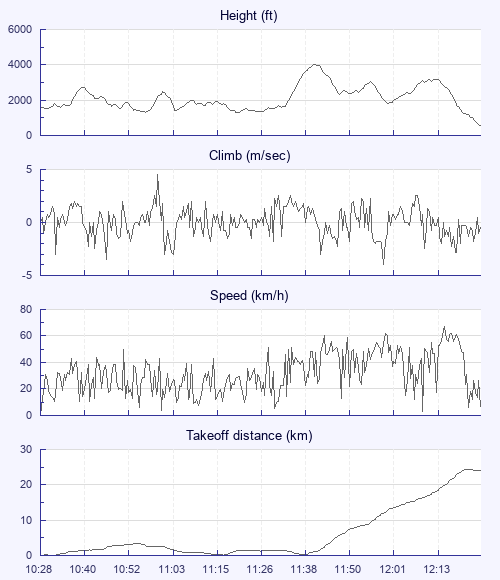
| Height - GPS data | |
| Maximum Height [11:40:41] |
4003 ft |
| Lowest Save [11:20:51] |
1293 ft |
| Takeoff Height [10:28:51] |
1529 ft |
| Landing Height [12:24:07] |
568 ft |
| Total Ascent | 12251 ft |
| Height Gain | |
| Above Takeoff | 2474 ft |
| Maximum | 2710 ft |
| Low Point as Lowest Save |
1293 ft |
| High Point as Maximum Height |
4003 ft |
| Units | |
| Climb - Pressure data | |
| Maximum Climb [10:59:55] |
4.5 m/s |
| Minimum Climb [11:59:07] |
-4.0 m/s |
| Units | |
| Speed | |
| Maximum Speed [12:15:35] |
67.5 km/h |
| Average Speed around course |
18.4 km/h |
| Average Speed over track length |
31.1 km/h |
| Units | |
| Tracklog | |
| Flight Duration | 1hr 55mins |
| Track Points | 6907 |
| Recording Interval | 1 secs |
| Statistics Interval | 4 secs |
| Track Length | 59.8 km |
| Units | |
| Flight instrument - reported as | |
| SKYTRAXX V1.60 SN:4028419520 |
| Height: | |
| Speed: | |
| Climb: | |
| Distance: |
| Main Map: |
| First Tab: |