


| Duration | 0:00 | Takeoff Distance | 0 |
| Height: | metres |
| Climb: | m/sec |
| Speed: | km/h |
| Distance: | km |
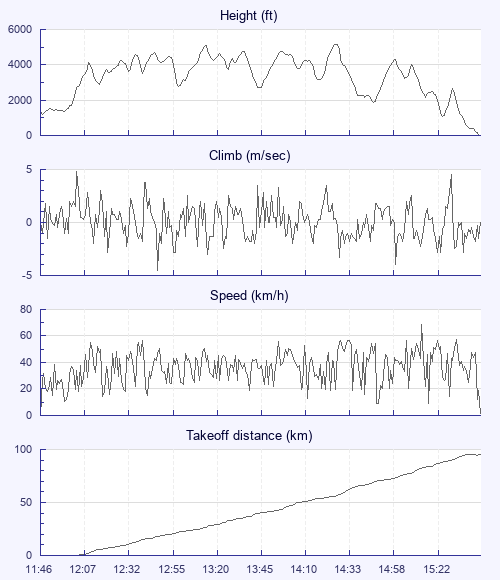
| Height - GPS data | |
| Maximum Height [14:30:06] |
5171 ft |
| Lowest Save [15:30:03] |
1093 ft |
| Takeoff Height [11:46:32] |
1332 ft |
| Landing Height [15:46:51] |
7 ft |
| Total Ascent | 27690 ft |
| Height Gain | |
| Above Takeoff | 3839 ft |
| Maximum | 3986 ft |
| Low Point [11:47:51] |
1184 ft |
| High Point as Maximum Height |
5171 ft |
| Units | |
| Climb - Pressure data | |
| Maximum Climb [12:04:16] |
4.8 m/s |
| Minimum Climb [12:49:20] |
-4.5 m/s |
| Units | |
| Speed | |
| Maximum Speed [15:19:00] |
68.4 km/h |
| Average Speed around course |
26.3 km/h |
| Average Speed over track length |
37.4 km/h |
| Units | |
| Tracklog | |
| Flight Duration | 4hrs |
| Track Points | 14420 |
| Recording Interval | 1 secs |
| Statistics Interval | 4 secs |
| Track Length | 149.9 km |
| Units | |
| Height: | |
| Speed: | |
| Climb: | |
| Distance: |
| Main Map: |
| First Tab: |