


| Duration | 0:00 | Takeoff Distance | 0 |
| Height: | metres |
| Climb: | m/sec |
| Speed: | km/h |
| Distance: | km |
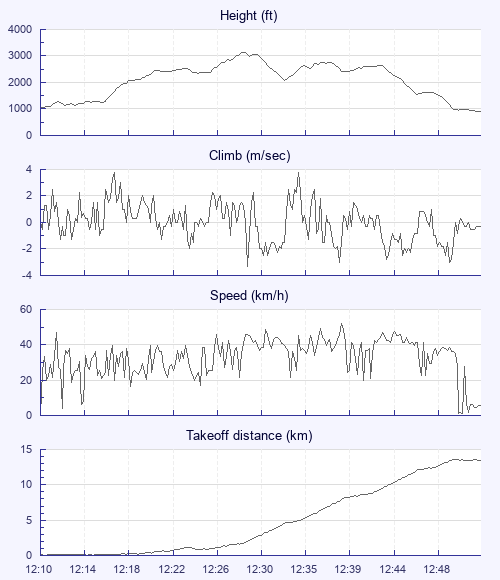
| Height - GPS data | |
| Maximum Height [12:29:45] |
3127 ft |
| Lowest Save [12:33:58] |
2070 ft |
| Takeoff Height [12:10:22] |
1043 ft |
| Landing Height [12:53:26] |
909 ft |
| Total Ascent | 4672 ft |
| Height Gain | |
| Above Takeoff | 2083 ft |
| Units | |
| Climb - Pressure data | |
| Maximum Climb [12:17:22] |
3.8 m/s |
| Minimum Climb [12:30:10] |
-3.3 m/s |
| Units | |
| Speed | |
| Maximum Speed [12:39:46] |
52.2 km/h |
| Average Speed around course |
23.0 km/h |
| Average Speed over track length |
33.2 km/h |
| Units | |
| Tracklog | |
| Flight Duration | 43mins |
| Track Points | 2585 |
| Recording Interval | 1 secs |
| Statistics Interval | 4 secs |
| Track Length | 23.8 km |
| Units | |
| Flight instrument - reported as | |
| Flymaster NavSD SN00870 SW1.06e |
| Height: | |
| Speed: | |
| Climb: | |
| Distance: |
| Main Map: |
| First Tab: |