


| Duration | 0:00 | Takeoff Distance | 0 |
| Height: | metres |
| Climb: | m/sec |
| Speed: | km/h |
| Distance: | km |
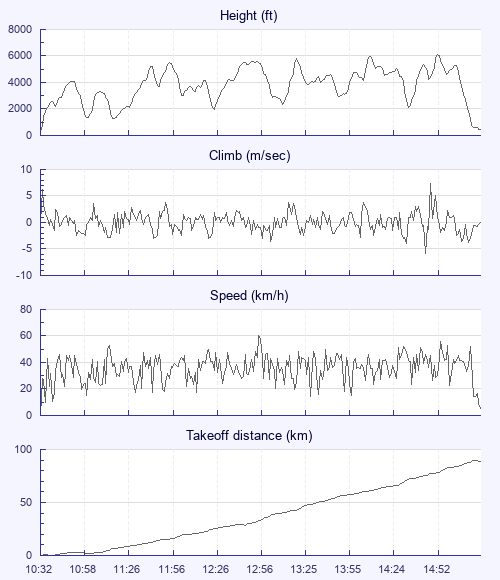
| Height - GPS data | |
| Maximum Height [14:58:30] |
6099 ft |
| Lowest Save [11:17:54] |
1283 ft |
| Takeoff Height [10:32:24] |
282 ft |
| Landing Height [15:23:05] |
430 ft |
| Total Ascent | 40892 ft |
| Height Gain | |
| Above Takeoff | 5817 ft |
| Maximum | 5823 ft |
| Low Point [10:32:34] |
276 ft |
| High Point as Maximum Height |
6099 ft |
| Units | |
| Climb - Pressure data | |
| Maximum Climb [14:54:33] |
7.3 m/s |
| Minimum Climb [14:52:09] |
-5.8 m/s |
| Units | |
| Speed | |
| Maximum Speed [12:58:41] |
60.3 km/h |
| Average Speed around course |
20.2 km/h |
| Average Speed over track length |
35.5 km/h |
| Units | |
| Tracklog | |
| Flight Duration | 4hrs 50mins |
| Track Points | 17441 |
| Recording Interval | 1 secs |
| Statistics Interval | 4 secs |
| Track Length | 171.9 km |
| Units | |
| Flight instrument | |
| Type | Oudie 3 |
| Model | Not Set |
| Firmware | 6.41.001 |
| Height: | |
| Speed: | |
| Climb: | |
| Distance: |
| Main Map: |
| First Tab: |