


| Duration | 0:00 | Takeoff Distance | 0 |
| Height: | metres |
| Climb: | m/sec |
| Speed: | km/h |
| Distance: | km |
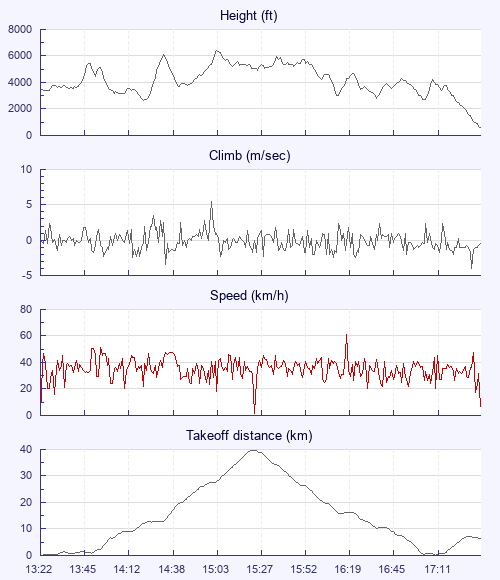
| Height - GPS data | |
| Maximum Height [15:06:24] |
6450 ft |
| Lowest Save [14:22:44] |
2654 ft |
| Takeoff Height [13:22:07] |
3553 ft |
| Landing Height [17:42:00] |
597 ft |
| Total Ascent | 26545 ft |
| Height Gain | |
| Above Takeoff | 2897 ft |
| Maximum | 3796 ft |
| Low Point as Lowest Save |
2654 ft |
| High Point as Maximum Height |
6450 ft |
| Units | |
| Climb - GPS data | |
| Maximum Climb [15:03:55] |
5.5 m/s |
| Minimum Climb [17:37:47] |
-4.0 m/s |
| Units | |
| Speed | |
| Maximum Speed [16:23:35] |
61.2 km/h |
| Average Speed around course |
21.7 km/h |
| Average Speed over track length |
36.0 km/h |
| Units | |
| Tracklog | |
| Flight Duration | 4hrs 19mins |
| Track Points | 15590 |
| Recording Interval | 1 secs |
| Statistics Interval | 4 secs |
| Track Length | 155.9 km |
| Invalid Positions [< 1%] |
3 |
| Units | |
| Flight instrument | |
| Type | Lk8000 Pna Generic |
| Model | Not Set |
| Firmware | 5.0a |
| Height: | |
| Speed: | |
| Climb: | |
| Distance: |
| Main Map: |
| First Tab: |