


| Duration | 0:00 | Takeoff Distance | 0 |
| Height: | metres |
| Climb: | m/sec |
| Speed: | km/h |
| Distance: | km |
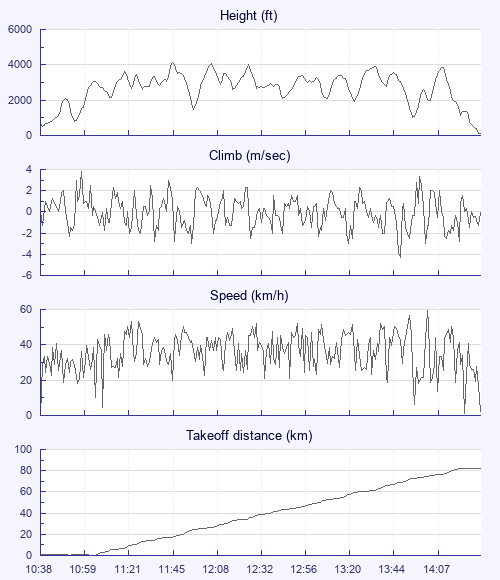
| Height - GPS data | |
| Maximum Height [11:46:33] |
4140 ft |
| Lowest Save [10:56:53] |
807 ft |
| Takeoff Height [10:38:02] |
679 ft |
| Landing Height [14:33:13] |
95 ft |
| Total Ascent | 27933 ft |
| Height Gain | |
| Above Takeoff | 3461 ft |
| Maximum | 3665 ft |
| Low Point [10:39:06] |
476 ft |
| High Point as Maximum Height |
4140 ft |
| Units | |
| Climb - Pressure data | |
| Maximum Climb [10:58:50] |
3.8 m/s |
| Minimum Climb [13:53:06] |
-4.3 m/s |
| Units | |
| Speed | |
| Maximum Speed [14:07:50] |
59.4 km/h |
| Average Speed around course |
24.4 km/h |
| Average Speed over track length |
36.2 km/h |
| Units | |
| Tracklog | |
| Flight Duration | 3hrs 55mins |
| Track Points | 14112 |
| Recording Interval | 1 secs |
| Statistics Interval | 4 secs |
| Track Length | 142.0 km |
| Units | |
| Flight instrument | |
| Type | Oudie 4 |
| Model | Not Set |
| Firmware | 7.01.001 |
| Height: | |
| Speed: | |
| Climb: | |
| Distance: |
| Main Map: |
| First Tab: |