


| Duration | 0:00 | Takeoff Distance | 0 |
| Height: | metres |
| Climb: | m/sec |
| Speed: | km/h |
| Distance: | km |
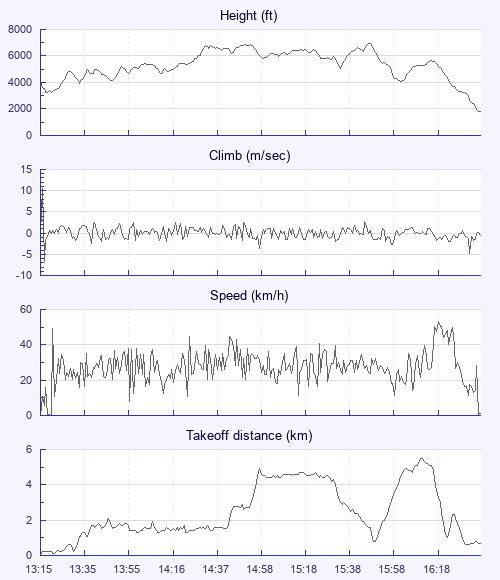
| Height - GPS data | |
| Maximum Height [15:48:59] |
6946 ft |
| Lowest Save [13:18:04] |
3215 ft |
| Takeoff Height [13:15:39] |
4091 ft |
| Landing Height [16:37:39] |
1814 ft |
| Total Ascent | 18596 ft |
| Height Gain | |
| Above Takeoff | 2854 ft |
| Maximum | 3730 ft |
| Low Point as Lowest Save |
3215 ft |
| High Point as Maximum Height |
6946 ft |
| Units | |
| Climb - GPS data | |
| Maximum Climb [13:16:44] |
10.6 m/s |
| Minimum Climb [13:16:49] |
-6.8 m/s |
| Units | |
| Speed | |
| Maximum Speed [16:19:34] |
53.3 km/h |
| Average Speed around course |
8.4 km/h |
| Average Speed over track length |
27.0 km/h |
| Units | |
| Tracklog | |
| Flight Duration | 3hrs 22mins |
| Track Points | 2392 |
| Recording Interval | 5 secs |
| Statistics Interval | 5 secs |
| Track Length | 91.0 km |
| Units | |
| Flight instrument - reported as | |
| GPSMap76C Software Version 4.20 |
| Height: | |
| Speed: | |
| Climb: | |
| Distance: |
| Main Map: |
| First Tab: |