


| Duration | 0:00 | Takeoff Distance | 0 |
| Height: | metres |
| Climb: | m/sec |
| Speed: | km/h |
| Distance: | km |
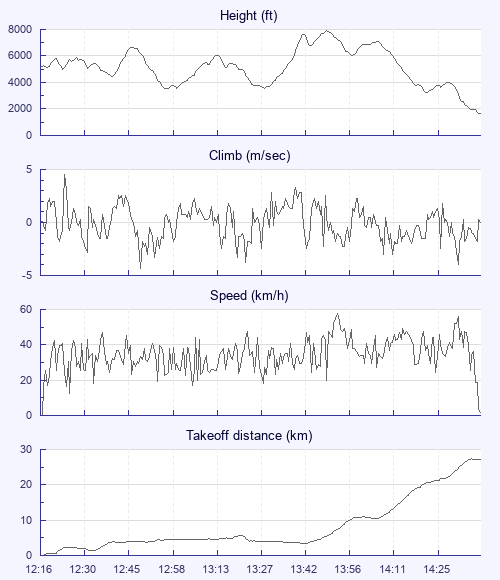
| Height - GPS data | |
| Maximum Height [13:51:29] |
7904 ft |
| Lowest Save [14:24:44] |
3228 ft |
| Takeoff Height [12:16:26] |
5167 ft |
| Landing Height [14:41:06] |
1631 ft |
| Total Ascent | 17411 ft |
| Height Gain | |
| Above Takeoff | 2736 ft |
| Maximum | 4390 ft |
| Low Point [13:00:36] |
3514 ft |
| High Point as Maximum Height |
7904 ft |
| Units | |
| Climb - Pressure data | |
| Maximum Climb [12:23:50] |
4.5 m/s |
| Minimum Climb [12:49:06] |
-4.3 m/s |
| Units | |
| Speed | |
| Maximum Speed [13:54:30] |
57.6 km/h |
| Average Speed around course |
17.6 km/h |
| Average Speed over track length |
34.5 km/h |
| Units | |
| Tracklog | |
| Flight Duration | 2hrs 24mins |
| Track Points | 8681 |
| Recording Interval | 1 secs |
| Statistics Interval | 4 secs |
| Track Length | 83.3 km |
| Units | |
| Flight instrument - reported as | |
| Flymaster Nav, SN01393, SW1.05h |
| Height: | |
| Speed: | |
| Climb: | |
| Distance: |
| Main Map: |
| First Tab: |