


| Duration | 0:00 | Takeoff Distance | 0 |
| Height: | metres |
| Climb: | m/sec |
| Speed: | km/h |
| Distance: | km |
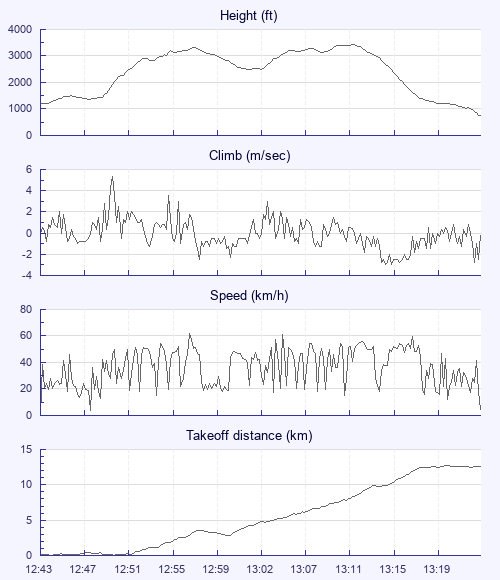
| Height - GPS data | |
| Maximum Height [13:12:03] |
3425 ft |
| Lowest Save [13:02:12] |
2480 ft |
| Takeoff Height [12:43:06] |
1211 ft |
| Landing Height [13:23:32] |
761 ft |
| Total Ascent | 4580 ft |
| Height Gain | |
| Above Takeoff | 2215 ft |
| Maximum | 2221 ft |
| Low Point [12:43:10] |
1204 ft |
| High Point as Maximum Height |
3425 ft |
| Units | |
| Climb - Pressure data | |
| Maximum Climb [12:49:42] |
5.3 m/s |
| Minimum Climb [13:15:02] |
-3.0 m/s |
| Units | |
| Speed | |
| Maximum Speed [12:56:54] |
62.1 km/h |
| Average Speed around course |
24.5 km/h |
| Average Speed over track length |
37.1 km/h |
| Units | |
| Tracklog | |
| Flight Duration | 40mins |
| Track Points | 2427 |
| Recording Interval | 1 secs |
| Statistics Interval | 4 secs |
| Track Length | 25.0 km |
| Units | |
| Height: | |
| Speed: | |
| Climb: | |
| Distance: |
| Main Map: |
| First Tab: |