


| Duration | 0:00 | Takeoff Distance | 0 |
| Height: | metres |
| Climb: | m/sec |
| Speed: | km/h |
| Distance: | km |
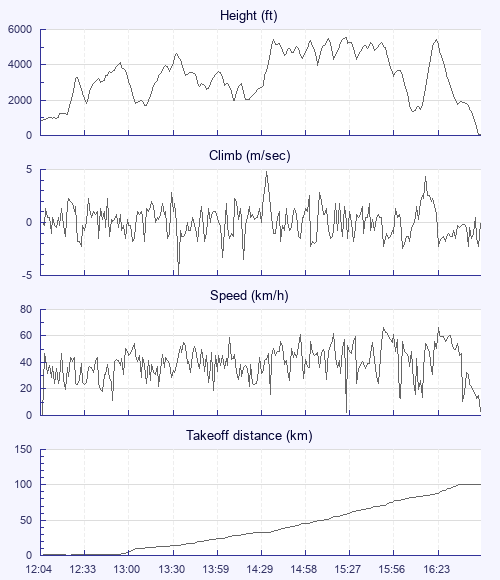
| Height - GPS data | |
| Maximum Height [15:24:59] |
5522 ft |
| Lowest Save [16:07:42] |
1362 ft |
| Takeoff Height [12:04:32] |
823 ft |
| Landing Height [16:49:08] |
43 ft |
| Total Ascent | 32825 ft |
| Height Gain | |
| Above Takeoff | 4698 ft |
| Maximum | 4705 ft |
| Low Point [12:04:37] |
817 ft |
| High Point as Maximum Height |
5522 ft |
| Units | |
| Climb - Pressure data | |
| Maximum Climb [14:32:29] |
4.8 m/s |
| Minimum Climb [13:34:21] |
-5.0 m/s |
| Units | |
| Speed | |
| Maximum Speed [15:49:53] |
66.6 km/h |
| Average Speed around course |
25.6 km/h |
| Average Speed over track length |
40.0 km/h |
| Units | |
| Tracklog | |
| Flight Duration | 4hrs 44mins |
| Track Points | 17076 |
| Recording Interval | 1 secs |
| Statistics Interval | 4 secs |
| Track Length | 189.6 km |
| Units | |
| Flight instrument | |
| Type | Oudie 3 |
| Model | Not Set |
| Firmware | 7.00.001 |
| Height: | |
| Speed: | |
| Climb: | |
| Distance: |
| Main Map: |
| First Tab: |