


| Duration | 0:00 | Takeoff Distance | 0 |
| Height: | metres |
| Climb: | m/sec |
| Speed: | km/h |
| Distance: | km |
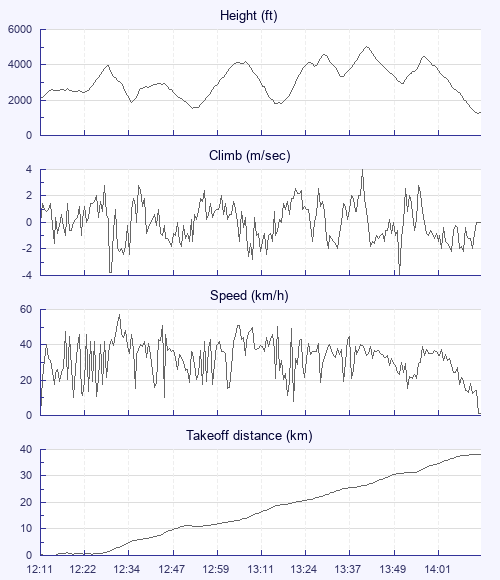
| Height - GPS data | |
| Maximum Height [13:45:17] |
5016 ft |
| Lowest Save [12:54:27] |
1529 ft |
| Takeoff Height [12:11:37] |
2139 ft |
| Landing Height [14:17:47] |
1276 ft |
| Total Ascent | 13543 ft |
| Height Gain | |
| Above Takeoff | 2877 ft |
| Maximum | 3488 ft |
| Low Point as Lowest Save |
1529 ft |
| High Point as Maximum Height |
5016 ft |
| Units | |
| Climb - Pressure data | |
| Maximum Climb [13:44:42] |
4.0 m/s |
| Minimum Climb [13:54:22] |
-4.0 m/s |
| Units | |
| Speed | |
| Maximum Speed [12:33:22] |
56.9 km/h |
| Average Speed around course |
20.6 km/h |
| Average Speed over track length |
32.1 km/h |
| Units | |
| Tracklog | |
| Flight Duration | 2hrs 6mins |
| Track Points | 1515 |
| Recording Interval | 5 secs |
| Statistics Interval | 5 secs |
| Track Length | 67.4 km |
| Units | |
| Height: | |
| Speed: | |
| Climb: | |
| Distance: |
| Main Map: |
| First Tab: |