


| Duration | 0:00 | Takeoff Distance | 0 |
| Height: | metres |
| Climb: | m/sec |
| Speed: | km/h |
| Distance: | km |
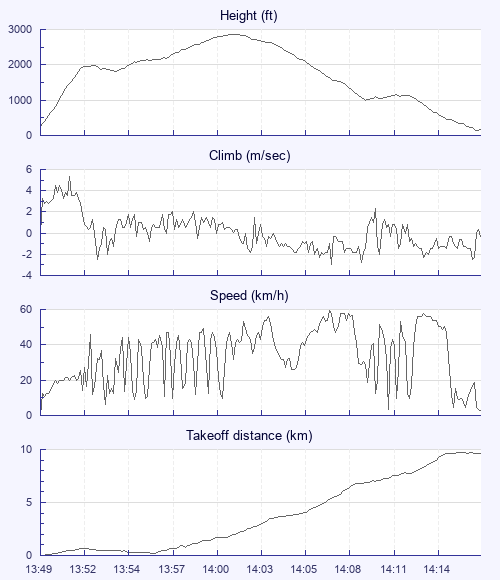
| Height - GPS data | |
| Maximum Height [14:01:31] |
2871 ft |
| Takeoff Height [13:49:41] |
266 ft |
| Landing Height [14:16:33] |
161 ft |
| Total Ascent | 3274 ft |
| Height Gain | |
| Above Takeoff | 2605 ft |
| Units | |
| Climb - Pressure data | |
| Maximum Climb [13:51:29] |
5.3 m/s |
| Minimum Climb [14:07:33] |
-3.0 m/s |
| Units | |
| Speed | |
| Maximum Speed [14:07:25] |
59.4 km/h |
| Average Speed around course |
27.0 km/h |
| Average Speed over track length |
33.9 km/h |
| Units | |
| Tracklog | |
| Flight Duration | 26mins |
| Track Points | 1613 |
| Recording Interval | 1 secs |
| Statistics Interval | 4 secs |
| Track Length | 15.2 km |
| Units | |
| Flight instrument - reported as | |
| Flymaster F1, V1.3, S/N 2703 |
| Height: | |
| Speed: | |
| Climb: | |
| Distance: |
| Main Map: |
| First Tab: |