


| Duration | 0:00 | Takeoff Distance | 0 |
| Height: | metres |
| Climb: | m/sec |
| Speed: | km/h |
| Distance: | km |
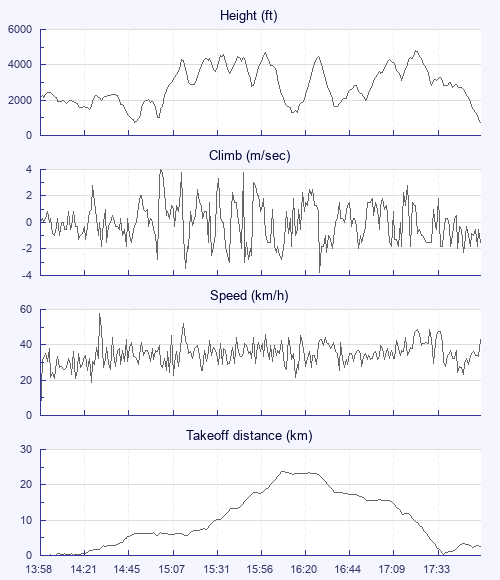
| Height - GPS data | |
| Maximum Height [17:23:35] |
4787 ft |
| Lowest Save [14:47:40] |
745 ft |
| Takeoff Height [13:58:00] |
2156 ft |
| Landing Height [17:58:03] |
725 ft |
| Total Ascent | 25843 ft |
| Height Gain | |
| Above Takeoff | 2631 ft |
| Maximum | 4042 ft |
| Low Point as Lowest Save |
745 ft |
| High Point as Maximum Height |
4787 ft |
| Units | |
| Climb - GPS data | |
| Maximum Climb [15:01:48] |
4.0 m/s |
| Minimum Climb [16:29:27] |
-3.8 m/s |
| Units | |
| Speed | |
| Maximum Speed [14:29:12] |
57.6 km/h |
| Average Speed around course |
13.3 km/h |
| Average Speed over track length |
34.6 km/h |
| Units | |
| Tracklog | |
| Flight Duration | 4hrs |
| Track Points | 3601 |
| Recording Interval | 4 secs |
| Statistics Interval | 4 secs |
| Track Length | 138.6 km |
| Units | |
| Flight instrument - reported as | |
| GPSMap60CX Software Version 3.90 |
| Height: | |
| Speed: | |
| Climb: | |
| Distance: |
| Main Map: |
| First Tab: |