


| Duration | 0:00 | Takeoff Distance | 0 |
| Height: | metres |
| Climb: | m/sec |
| Speed: | km/h |
| Distance: | km |
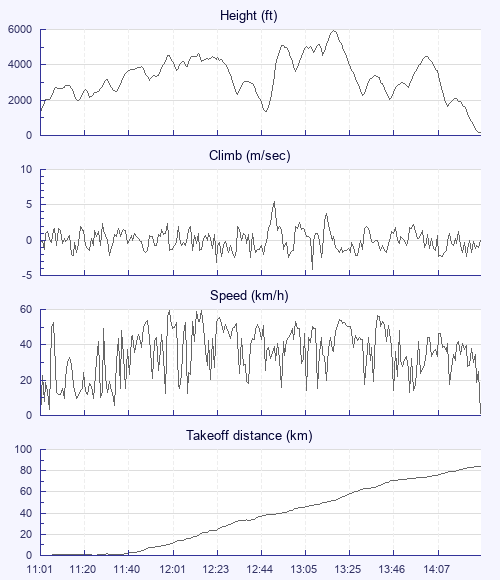
| Height - GPS data | |
| Maximum Height [13:20:05] |
5938 ft |
| Lowest Save [12:47:50] |
1375 ft |
| Takeoff Height [11:01:11] |
1280 ft |
| Landing Height [14:29:59] |
197 ft |
| Total Ascent | 24429 ft |
| Height Gain | |
| Above Takeoff | 4659 ft |
| Units | |
| Climb - GPS data | |
| Maximum Climb [12:51:53] |
5.5 m/s |
| Minimum Climb [13:10:29] |
-4.2 m/s |
| Units | |
| Speed | |
| Maximum Speed [12:00:59] |
59.4 km/h |
| Average Speed around course |
26.0 km/h |
| Average Speed over track length |
36.8 km/h |
| Units | |
| Tracklog | |
| Flight Duration | 3hrs 28mins |
| Track Points | 4177 |
| Recording Interval | 3 secs |
| Statistics Interval | 6 secs |
| Track Length | 127.9 km |
| Units | |
| Flight instrument - reported as | |
| GPSMap60CSX Software Version 4.00 |
| Height: | |
| Speed: | |
| Climb: | |
| Distance: |
| Main Map: |
| First Tab: |