


| Duration | 0:00 | Takeoff Distance | 0 |
| Height: | metres |
| Climb: | m/sec |
| Speed: | km/h |
| Distance: | km |
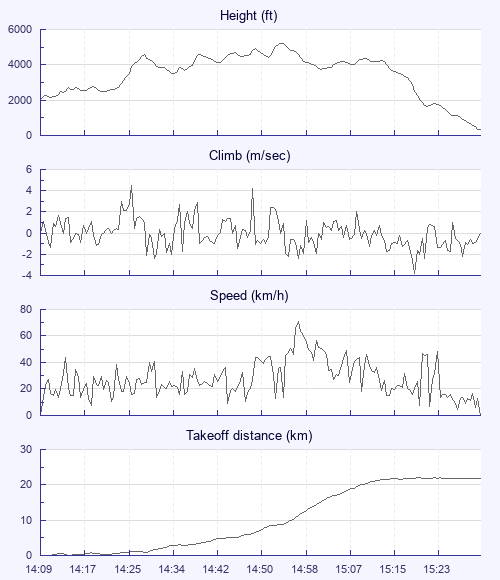
| Height - GPS data | |
| Maximum Height [14:55:56] |
5217 ft |
| Lowest Save [14:34:36] |
3520 ft |
| Takeoff Height [14:09:46] |
2028 ft |
| Landing Height [15:33:46] |
358 ft |
| Total Ascent | 7825 ft |
| Height Gain | |
| Above Takeoff | 3189 ft |
| Units | |
| Climb - Pressure data | |
| Maximum Climb [14:26:46] |
4.5 m/s |
| Minimum Climb [15:21:16] |
-3.8 m/s |
| Units | |
| Speed | |
| Maximum Speed [14:58:46] |
70.6 km/h |
| Average Speed around course |
19.6 km/h |
| Average Speed over track length |
27.4 km/h |
| Units | |
| Tracklog | |
| Flight Duration | 1hr 24mins |
| Track Points | 505 |
| Recording Interval | 10 secs |
| Statistics Interval | 10 secs |
| Track Length | 38.3 km |
| Units | |
| Flight instrument - reported as | |
| AIRCOTEC SN:275 SW:3.5 |
| Height: | |
| Speed: | |
| Climb: | |
| Distance: |
| Main Map: |
| First Tab: |