


| Duration | 0:00 | Takeoff Distance | 0 |
| Height: | metres |
| Climb: | m/sec |
| Speed: | km/h |
| Distance: | km |
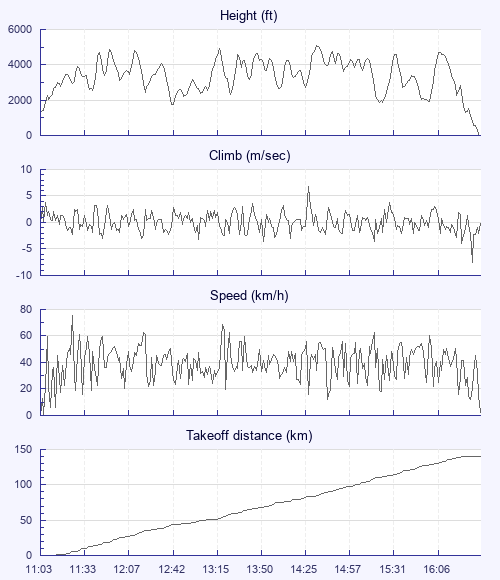
| Height - GPS data | |
| Maximum Height [14:34:10] |
5075 ft |
| Lowest Save [12:42:07] |
1739 ft |
| Takeoff Height [11:03:33] |
1299 ft |
| Landing Height [16:36:01] |
10 ft |
| Total Ascent | 44951 ft |
| Height Gain | |
| Above Takeoff | 3776 ft |
| Maximum | 3783 ft |
| Low Point [11:03:54] |
1293 ft |
| High Point as Maximum Height |
5075 ft |
| Units | |
| Climb - Pressure data | |
| Maximum Climb [14:28:23] |
6.8 m/s |
| Minimum Climb [16:33:51] |
-7.5 m/s |
| Units | |
| Speed | |
| Maximum Speed [11:24:19] |
75.6 km/h |
| Average Speed around course |
26.2 km/h |
| Average Speed over track length |
40.3 km/h |
| Units | |
| Tracklog | |
| Flight Duration | 5hrs 32mins |
| Track Points | 19931 |
| Recording Interval | 1 secs |
| Statistics Interval | 4 secs |
| Track Length | 223.2 km |
| Units | |
| Height: | |
| Speed: | |
| Climb: | |
| Distance: |
| Main Map: |
| First Tab: |