


| Duration | 0:00 | Takeoff Distance | 0 |
| Height: | metres |
| Climb: | m/sec |
| Speed: | km/h |
| Distance: | km |
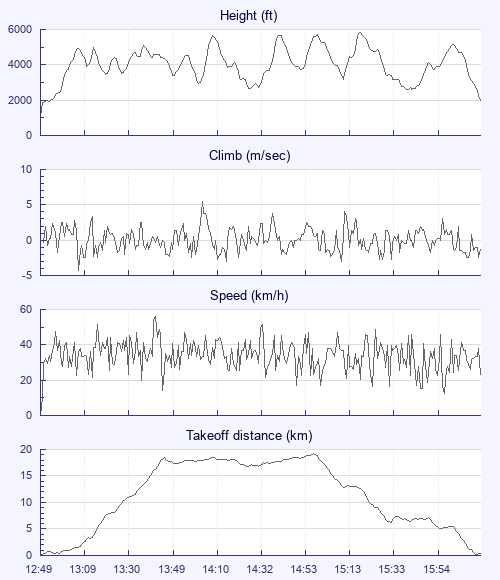
| Height - GPS data | |
| Maximum Height [15:22:18] |
5827 ft |
| Lowest Save [15:45:02] |
2598 ft |
| Takeoff Height [12:49:42] |
1056 ft |
| Landing Height [16:20:35] |
1982 ft |
| Total Ascent | 24331 ft |
| Height Gain | |
| Above Takeoff | 4770 ft |
| Units | |
| Climb - Pressure data | |
| Maximum Climb [14:06:21] |
5.5 m/s |
| Minimum Climb [13:07:12] |
-4.3 m/s |
| Units | |
| Speed | |
| Maximum Speed [13:45:05] |
55.8 km/h |
| Average Speed around course |
17.1 km/h |
| Average Speed over track length |
33.6 km/h |
| Units | |
| Tracklog | |
| Flight Duration | 3hrs 30mins |
| Track Points | 12627 |
| Recording Interval | 1 secs |
| Statistics Interval | 4 secs |
| Track Length | 118.1 km |
| Units | |
| Flight instrument - reported as | |
| XC Trainer V3.5-01, S/N 7123 |
| Height: | |
| Speed: | |
| Climb: | |
| Distance: |
| Main Map: |
| First Tab: |