


| Duration | 0:00 | Takeoff Distance | 0 |
| Height: | metres |
| Climb: | m/sec |
| Speed: | km/h |
| Distance: | km |
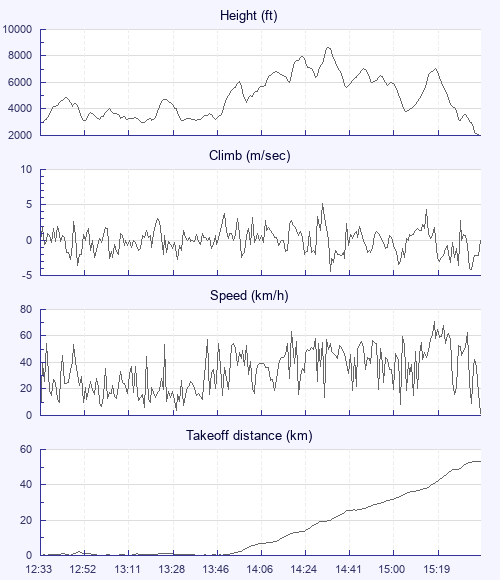
| Height - GPS data | |
| Maximum Height [14:37:08] |
8609 ft |
| Lowest Save [13:18:18] |
2966 ft |
| Takeoff Height [12:33:08] |
2910 ft |
| Landing Height [15:41:43] |
2028 ft |
| Total Ascent | 23291 ft |
| Height Gain | |
| Above Takeoff | 5699 ft |
| Maximum | 5702 ft |
| Low Point [12:33:48] |
2907 ft |
| High Point as Maximum Height |
8609 ft |
| Units | |
| Climb - Pressure data | |
| Maximum Climb [14:35:33] |
5.2 m/s |
| Minimum Climb [14:37:23] |
-4.4 m/s |
| Units | |
| Speed | |
| Maximum Speed [15:23:08] |
70.6 km/h |
| Average Speed around course |
20.8 km/h |
| Average Speed over track length |
34.1 km/h |
| Units | |
| Tracklog | |
| Flight Duration | 3hrs 8mins |
| Track Points | 2258 |
| Recording Interval | 5 secs |
| Statistics Interval | 5 secs |
| Track Length | 107.2 km |
| Units | |
| Flight instrument | |
| Type | Flytec |
| Model | 6015 |
| Firmware | 1.3.07 Eng |
| Height: | |
| Speed: | |
| Climb: | |
| Distance: |
| Main Map: |
| First Tab: |