


| Duration | 0:00 | Takeoff Distance | 0 |
| Height: | metres |
| Climb: | m/sec |
| Speed: | km/h |
| Distance: | km |
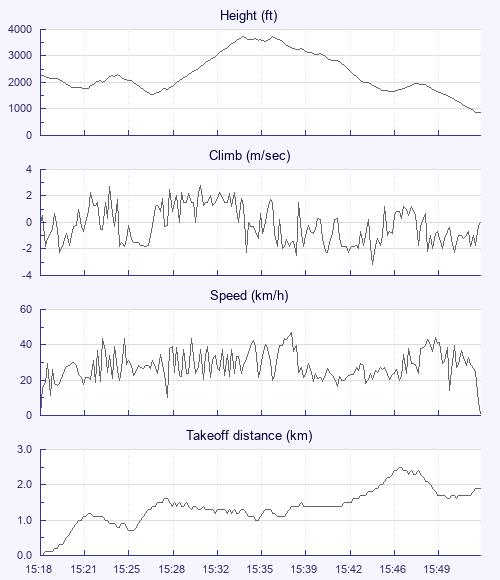
| Height - GPS data | |
| Maximum Height [15:37:23] |
3730 ft |
| Lowest Save [15:27:41] |
1558 ft |
| Takeoff Height [15:18:35] |
2215 ft |
| Landing Height [15:53:47] |
850 ft |
| Total Ascent | 3911 ft |
| Height Gain | |
| Above Takeoff | 1516 ft |
| Maximum | 2172 ft |
| Low Point as Lowest Save |
1558 ft |
| High Point as Maximum Height |
3730 ft |
| Units | |
| Climb - Pressure data | |
| Maximum Climb [15:31:23] |
2.8 m/s |
| Minimum Climb [15:45:17] |
-3.2 m/s |
| Units | |
| Speed | |
| Maximum Speed [15:38:53] |
46.8 km/h |
| Average Speed around course |
5.7 km/h |
| Average Speed over track length |
28.3 km/h |
| Units | |
| Tracklog | |
| Flight Duration | 35mins |
| Track Points | 705 |
| Recording Interval | 3 secs |
| Statistics Interval | 6 secs |
| Track Length | 16.6 km |
| Units | |
| Flight instrument - reported as | |
| Flymaster F1, V1.5, S/N 376 |
| Height: | |
| Speed: | |
| Climb: | |
| Distance: |
| Main Map: |
| First Tab: |