


| Duration | 0:00 | Takeoff Distance | 0 |
| Height: | metres |
| Climb: | m/sec |
| Speed: | km/h |
| Distance: | km |
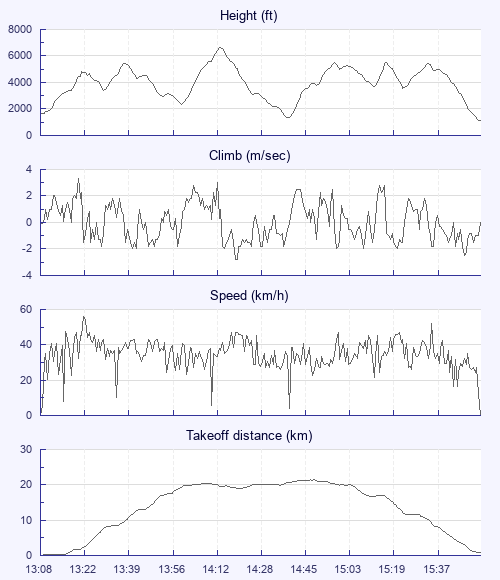
| Height - GPS data | |
| Maximum Height [14:15:30] |
6670 ft |
| Lowest Save [14:41:31] |
1368 ft |
| Takeoff Height [13:08:18] |
1673 ft |
| Landing Height [15:57:42] |
1145 ft |
| Total Ascent | 22100 ft |
| Height Gain | |
| Above Takeoff | 4997 ft |
| Maximum | 5023 ft |
| Low Point [13:08:33] |
1647 ft |
| High Point as Maximum Height |
6670 ft |
| Units | |
| Climb - Pressure data | |
| Maximum Climb [13:21:22] |
3.3 m/s |
| Minimum Climb [14:20:42] |
-2.8 m/s |
| Units | |
| Speed | |
| Maximum Speed [13:22:42] |
55.8 km/h |
| Average Speed around course |
20.0 km/h |
| Average Speed over track length |
34.8 km/h |
| Units | |
| Tracklog | |
| Flight Duration | 2hrs 49mins |
| Track Points | 10165 |
| Recording Interval | 1 secs |
| Statistics Interval | 4 secs |
| Track Length | 98.2 km |
| Units | |
| Flight instrument | |
| Type | Flyskyhy |
| Model | 6.2 |
| Firmware | 6.2 |
| Height: | |
| Speed: | |
| Climb: | |
| Distance: |
| Main Map: |
| First Tab: |