


| Duration | 0:00 | Takeoff Distance | 0 |
| Height: | metres |
| Climb: | m/sec |
| Speed: | km/h |
| Distance: | km |
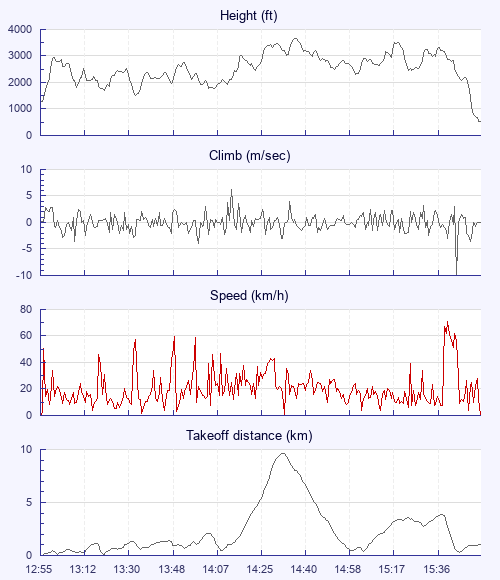
| Height - GPS data | |
| Maximum Height [14:39:42] |
3648 ft |
| Lowest Save [13:34:02] |
1503 ft |
| Takeoff Height [12:55:31] |
1276 ft |
| Landing Height [15:54:51] |
525 ft |
| Total Ascent | 19662 ft |
| Height Gain | |
| Above Takeoff | 2372 ft |
| Maximum | 2375 ft |
| Low Point [12:55:36] |
1273 ft |
| High Point as Maximum Height |
3648 ft |
| Units | |
| Climb - Pressure data | |
| Maximum Climb [14:14:56] |
6.3 m/s |
| Minimum Climb [15:46:04] |
-9.8 m/s |
| Units | |
| Speed | |
| Maximum Speed [15:42:59] |
71.1 km/h |
| Average Speed around course |
8.7 km/h |
| Average Speed over track length |
20.3 km/h |
| Units | |
| Tracklog | |
| Flight Duration | 2hrs 59mins |
| Track Points | 10614 |
| Recording Interval | 1 secs |
| Statistics Interval | 4 secs |
| Track Length | 60.6 km |
| Invalid Positions [< 1%] |
1 |
| Units | |
| Flight instrument | |
| Type | Xc_tracer |
| Model | Not Set |
| Firmware | Xc_tracer_v1.0_r05 |
| Height: | |
| Speed: | |
| Climb: | |
| Distance: |
| Main Map: |
| First Tab: |