


| Duration | 0:00 | Takeoff Distance | 0 |
| Height: | metres |
| Climb: | m/sec |
| Speed: | km/h |
| Distance: | km |
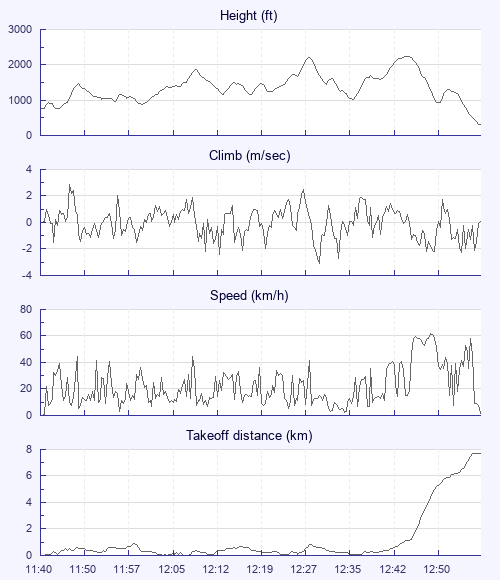
| Height - GPS data | |
| Maximum Height [12:45:20] |
2238 ft |
| Lowest Save [11:59:57] |
889 ft |
| Takeoff Height [11:40:51] |
761 ft |
| Landing Height [12:56:50] |
322 ft |
| Total Ascent | 6043 ft |
| Height Gain | |
| Above Takeoff | 1476 ft |
| Maximum | 1486 ft |
| Low Point [11:45:29] |
751 ft |
| High Point as Maximum Height |
2238 ft |
| Units | |
| Climb - Pressure data | |
| Maximum Climb [11:47:20] |
2.9 m/s |
| Minimum Climb [12:29:52] |
-3.1 m/s |
| Units | |
| Speed | |
| Maximum Speed [12:48:52] |
61.9 km/h |
| Average Speed around course |
9.7 km/h |
| Average Speed over track length |
20.3 km/h |
| Units | |
| Tracklog | |
| Flight Duration | 1hr 15mins |
| Track Points | 444 |
| Recording Interval | 10 secs |
| Statistics Interval | 10 secs |
| Track Length | 25.7 km |
| Units | |
| Flight instrument | |
| Type | Brauniger |
| Model | Compeo+ |
| Firmware | 3.38m |
| Height: | |
| Speed: | |
| Climb: | |
| Distance: |
| Main Map: |
| First Tab: |