


| Duration | 0:00 | Takeoff Distance | 0 |
| Height: | metres |
| Climb: | m/sec |
| Speed: | km/h |
| Distance: | km |
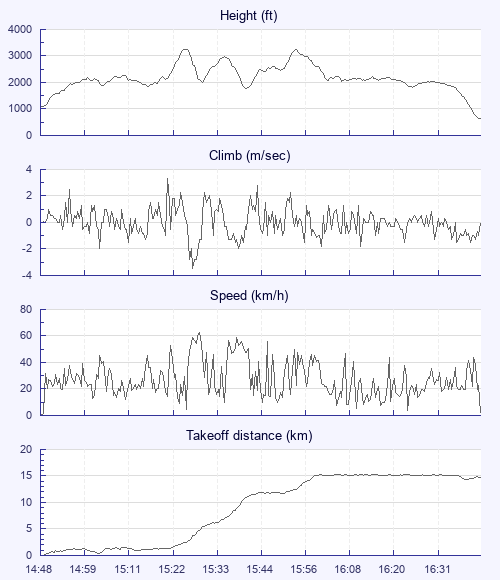
| Height - GPS data | |
| Maximum Height [15:25:38] |
3261 ft |
| Lowest Save [15:41:08] |
1768 ft |
| Takeoff Height [14:48:12] |
1076 ft |
| Landing Height [16:43:03] |
623 ft |
| Total Ascent | 8957 ft |
| Height Gain | |
| Above Takeoff | 2185 ft |
| Units | |
| Climb - Pressure data | |
| Maximum Climb [15:20:52] |
3.3 m/s |
| Minimum Climb [15:27:20] |
-3.5 m/s |
| Units | |
| Speed | |
| Maximum Speed [15:28:32] |
63.0 km/h |
| Average Speed around course |
10.2 km/h |
| Average Speed over track length |
27.9 km/h |
| Units | |
| Tracklog | |
| Flight Duration | 1hr 54mins |
| Track Points | 6892 |
| Recording Interval | 1 secs |
| Statistics Interval | 4 secs |
| Track Length | 53.5 km |
| Units | |
| Flight instrument - reported as | |
| SKYTRAXX V1.76 SN:450323594 |
| Height: | |
| Speed: | |
| Climb: | |
| Distance: |
| Main Map: |
| First Tab: |