


| Duration | 0:00 | Takeoff Distance | 0 |
| Height: | metres |
| Climb: | m/sec |
| Speed: | km/h |
| Distance: | km |
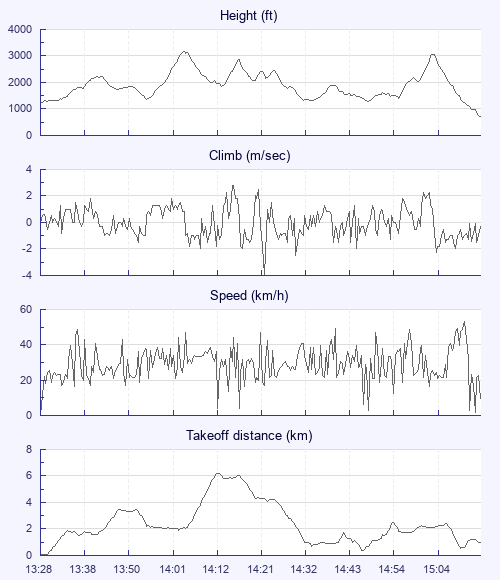
| Height - GPS data | |
| Maximum Height [14:05:31] |
3166 ft |
| Lowest Save [14:50:50] |
1299 ft |
| Takeoff Height [13:28:11] |
1224 ft |
| Landing Height [15:17:42] |
712 ft |
| Total Ascent | 9731 ft |
| Height Gain | |
| Above Takeoff | 1942 ft |
| Maximum | 1955 ft |
| Low Point [13:28:19] |
1211 ft |
| High Point as Maximum Height |
3166 ft |
| Units | |
| Climb - Pressure data | |
| Maximum Climb [14:16:55] |
2.8 m/s |
| Minimum Climb [14:24:23] |
-4.0 m/s |
| Units | |
| Speed | |
| Maximum Speed [15:15:07] |
53.1 km/h |
| Average Speed around course |
9.9 km/h |
| Average Speed over track length |
29.6 km/h |
| Units | |
| Tracklog | |
| Flight Duration | 1hr 49mins |
| Track Points | 6572 |
| Recording Interval | 1 secs |
| Statistics Interval | 4 secs |
| Track Length | 54.0 km |
| Units | |
| Flight instrument | |
| Type | Oudie 4 Basic |
| Model | Not Set |
| Firmware | 7.33.001 |
| Height: | |
| Speed: | |
| Climb: | |
| Distance: |
| Main Map: |
| First Tab: |