


| Duration | 0:00 | Takeoff Distance | 0 |
| Height: | metres |
| Climb: | m/sec |
| Speed: | km/h |
| Distance: | km |
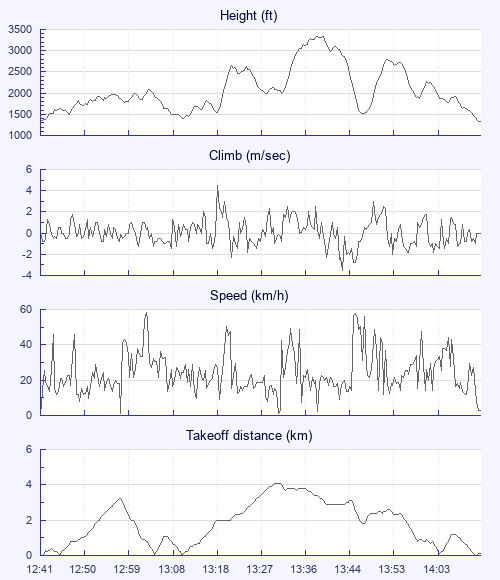
| Height - GPS data | |
| Maximum Height [13:39:40] |
3340 ft |
| Lowest Save [13:49:04] |
1519 ft |
| Takeoff Height [12:41:14] |
1332 ft |
| Landing Height [14:14:06] |
1335 ft |
| Total Ascent | 9045 ft |
| Height Gain | |
| Above Takeoff | 2008 ft |
| Units | |
| Climb - Pressure data | |
| Maximum Climb [13:19:02] |
4.5 m/s |
| Minimum Climb [13:44:58] |
-3.5 m/s |
| Units | |
| Speed | |
| Maximum Speed [13:04:02] |
58.5 km/h |
| Average Speed around course |
12.9 km/h |
| Average Speed over track length |
24.0 km/h |
| Units | |
| Tracklog | |
| Flight Duration | 1hr 32mins |
| Track Points | 5573 |
| Recording Interval | 1 secs |
| Statistics Interval | 4 secs |
| Track Length | 37.1 km |
| Units | |
| Flight instrument | |
| Type | Oudie 3 |
| Model | Not Set |
| Firmware | 7.11.001 |
| Height: | |
| Speed: | |
| Climb: | |
| Distance: |
| Main Map: |
| First Tab: |