


| Duration | 0:00 | Takeoff Distance | 0 |
| Height: | metres |
| Climb: | m/sec |
| Speed: | km/h |
| Distance: | km |
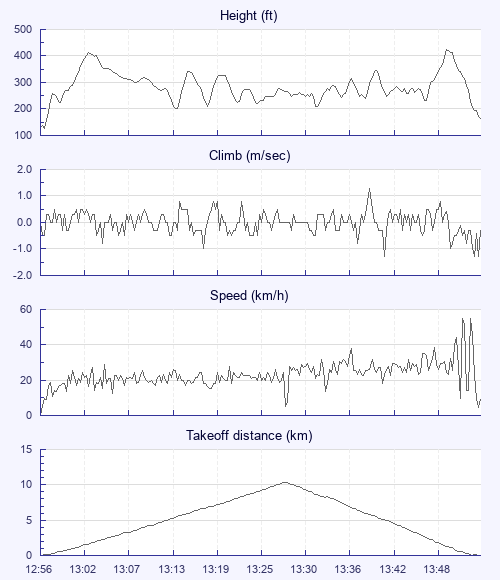
| Height - GPS data | |
| Maximum Height [13:49:15] |
423 ft |
| Takeoff Height [12:56:14] |
131 ft |
| Landing Height [13:52:18] |
164 ft |
| Total Ascent | 1978 ft |
| Height Gain | |
| Above Takeoff | 292 ft |
| Maximum | 295 ft |
| Low Point [12:56:45] |
128 ft |
| High Point as Maximum Height |
423 ft |
| Units | |
| Climb - Pressure data | |
| Maximum Climb [13:39:26] |
1.3 m/s |
| Minimum Climb [13:41:10] |
-1.3 m/s |
| Units | |
| Speed | |
| Maximum Speed [13:50:50] |
54.9 km/h |
| Average Speed around course |
22.2 km/h |
| Average Speed over track length |
23.3 km/h |
| Units | |
| Tracklog | |
| Flight Duration | 56mins |
| Track Points | 3365 |
| Recording Interval | 1 secs |
| Statistics Interval | 4 secs |
| Track Length | 21.8 km |
| Units | |
| Flight instrument | |
| Type | Oudie 3 |
| Model | Not Set |
| Firmware | 7.40.004 |
| Height: | |
| Speed: | |
| Climb: | |
| Distance: |
| Main Map: |
| First Tab: |