


| Duration | 0:00 | Takeoff Distance | 0 |
| Height: | metres |
| Climb: | m/sec |
| Speed: | km/h |
| Distance: | km |
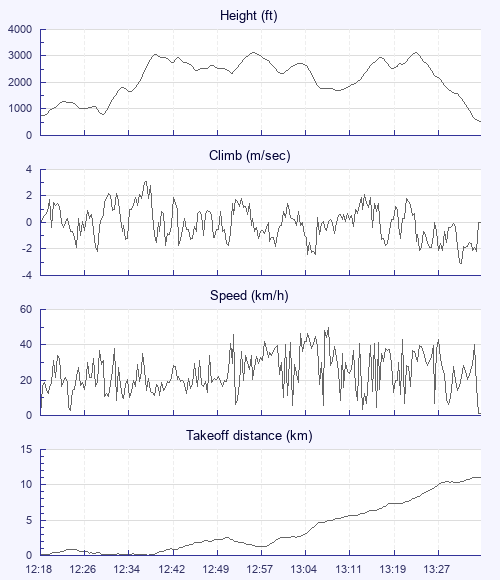
| Height - GPS data | |
| Maximum Height [12:56:21] |
3133 ft |
| Lowest Save [13:10:31] |
1693 ft |
| Takeoff Height [12:18:50] |
722 ft |
| Landing Height [13:34:31] |
531 ft |
| Total Ascent | 6660 ft |
| Height Gain | |
| Above Takeoff | 2411 ft |
| Units | |
| Climb - Pressure data | |
| Maximum Climb [12:37:41] |
3.1 m/s |
| Minimum Climb [13:31:51] |
-3.1 m/s |
| Units | |
| Speed | |
| Maximum Speed [13:09:11] |
49.7 km/h |
| Average Speed around course |
15.2 km/h |
| Average Speed over track length |
24.4 km/h |
| Units | |
| Tracklog | |
| Flight Duration | 1hr 15mins |
| Track Points | 454 |
| Recording Interval | 10 secs |
| Statistics Interval | 10 secs |
| Track Length | 30.8 km |
| Units | |
| Flight instrument | |
| Type | Brauniger |
| Model | Competino+ |
| Firmware | 3.10r |
| Height: | |
| Speed: | |
| Climb: | |
| Distance: |
| Main Map: |
| First Tab: |