


| Duration | 0:00 | Takeoff Distance | 0 |
| Height: | metres |
| Climb: | m/sec |
| Speed: | km/h |
| Distance: | km |
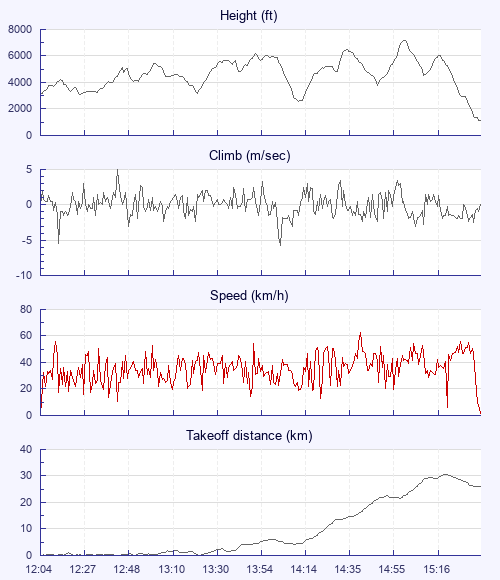
| Height - GPS data | |
| Maximum Height [15:03:36] |
7172 ft |
| Lowest Save [14:13:31] |
2595 ft |
| Takeoff Height [12:04:49] |
3120 ft |
| Landing Height [15:39:04] |
1125 ft |
| Total Ascent | 28005 ft |
| Height Gain | |
| Above Takeoff | 4052 ft |
| Maximum | 4577 ft |
| Low Point as Lowest Save |
2595 ft |
| High Point as Maximum Height |
7172 ft |
| Units | |
| Climb - Pressure data | |
| Maximum Climb [12:43:13] |
5.0 m/s |
| Minimum Climb [14:04:52] |
-5.8 m/s |
| Units | |
| Speed | |
| Maximum Speed [14:42:16] |
63.0 km/h |
| Average Speed around course |
21.7 km/h |
| Average Speed over track length |
35.3 km/h |
| Units | |
| Tracklog | |
| Flight Duration | 3hrs 34mins |
| Track Points | 6986 |
| Recording Interval | 2 secs |
| Statistics Interval | 4 secs |
| Track Length | 126.0 km |
| Invalid Positions [< 1%] |
4 |
| Units | |
| Flight instrument | |
| Type | Flyskyhy |
| Model | 6.9 |
| Firmware | 6.9 |
| Height: | |
| Speed: | |
| Climb: | |
| Distance: |
| Main Map: |
| First Tab: |