


| Duration | 0:00 | Takeoff Distance | 0 |
| Height: | metres |
| Climb: | m/sec |
| Speed: | km/h |
| Distance: | km |
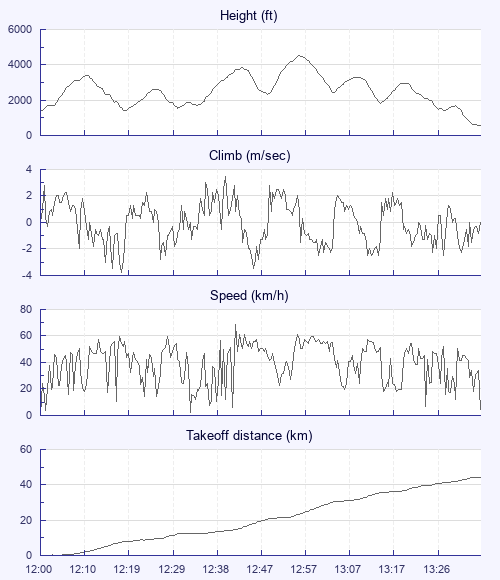
| Height - GPS data | |
| Maximum Height [12:56:15] |
4518 ft |
| Lowest Save [12:18:38] |
1407 ft |
| Takeoff Height [12:00:39] |
1368 ft |
| Landing Height [13:35:34] |
594 ft |
| Total Ascent | 12005 ft |
| Height Gain | |
| Above Takeoff | 3150 ft |
| Maximum | 3153 ft |
| Low Point [12:00:41] |
1365 ft |
| High Point as Maximum Height |
4518 ft |
| Units | |
| Climb - Pressure data | |
| Maximum Climb [12:40:03] |
3.5 m/s |
| Minimum Climb [12:18:19] |
-3.8 m/s |
| Units | |
| Speed | |
| Maximum Speed [12:42:11] |
68.4 km/h |
| Average Speed around course |
29.2 km/h |
| Average Speed over track length |
39.9 km/h |
| Units | |
| Tracklog | |
| Flight Duration | 1hr 34mins |
| Track Points | 5696 |
| Recording Interval | 1 secs |
| Statistics Interval | 4 secs |
| Track Length | 63.1 km |
| Units | |
| Flight instrument | |
| Type | Oudie 4 |
| Model | Not Set |
| Firmware | 7.30.001 |
| Height: | |
| Speed: | |
| Climb: | |
| Distance: |
| Main Map: |
| First Tab: |