Xc Title
User:Guest
Cloudbase Paragliding advert
Rafal Cypcar  All flights
Overseas League 2018
Flight type image
Turnpoint Flight on a Paraglider
Club
Grupa 303
Glider
Advance Sigma 10
Date
13th February 2018
Start
11:05
Finish
14:04
Duration
2hrs 59mins
Takeoff
Aquapanella
Landing
Zarzal
Coords
Takeoff
4.40430, -76.21087
Start
4.40428, -76.21087
TP1
4.40518, -76.19642
TP2
4.27095, -76.24590
TP3
4.53097, -76.00972
Finish
4.40028, -76.06598
Landing
4.40572, -76.06595
Distances and Score
Leg 1
1.61k
Leg 2
15.83k
Leg 3
38.91k
Leg 4
15.74k
Total
72.09k
Score
72.1
Open Distance
Total
38.9k
Filename
Use full pilot name
Download
Validated
No
Flight map
Notes

This map gives an overview of the flight, using the turnpoints to plot the track.

Use the for a detailed map and flight track.

Duration 0:00   Takeoff Distance 0
Controls
To animate the flight: click a point on the track, use the slider, or click the Play button.
slider
slider
Speed
Speed
Slower
Faster
Track color
No data
Highlights
Track data
Time: No data
Height:
Climb:
Speed:
Interval:
Units
Height: metres
Climb: m/sec
Speed: km/h
Distance: km
chart
Notes

Climb and Speed averaged over 4 second intervals.

These values may be lower than those shown by a flight instrument, which has access to continuous raw data.

Metric units are used for all chart data, except for Height which is shown in feet.

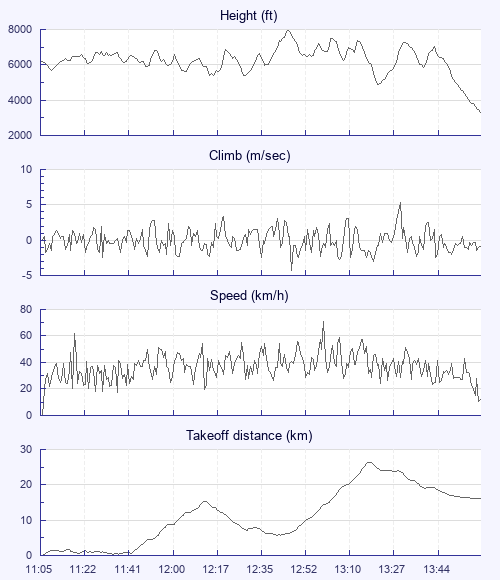
Height   -   Pressure data
Maximum Height
[12:49:57]
7917 ft
Lowest Save
[13:25:29]
4879 ft
Takeoff Height
[11:05:20]
6188 ft
Landing Height
[14:07:46]
3297 ft
Total Ascent 19888 ft
Height Gain
Above Takeoff 1729 ft
Maximum 2536 ft
Low Point
[12:31:54]
5381 ft
High Point
as Maximum Height
7917 ft
Units
Climb   -   Pressure data
Maximum Climb
[13:34:27]
5.3 m/s
Minimum Climb
[12:50:45]
-4.3 m/s
Units
Speed
Maximum Speed
[13:03:55]
71.1 km/h
Average Speed
around course
24.1 km/h
Average Speed
over track length
36.4 km/h
Units
Tracklog
Flight Duration 3hrs 2mins
Track Points 5638
Recording Interval 2 secs
Statistics Interval 4 secs
Track Length 110.8 km
Units
Flight instrument
Type Flyskyhy
Model 6.7
Firmware 6.7
Notes

Climb and Speed averaged over 4 second intervals.

These values may be lower than those shown by a flight instrument, which has access to continuous raw data.

Average Speed around course is measured from Start to Finish points.

Track Length is the cumulative distance between track points from Takeoff to Landing.

You can change the default units displayed - see the Options page.

Use this page to set various display Options. You can choose which units are used to display flight data, which map to show when the starts and which tab to show each time you view a flight.
Units settings

Metric units are used by default for the Statistics and XC Player pages, except for Height data which is shown in feet. You can choose your own custom settings here.

Height:
Speed:
Climb:
Distance:
  Use default
XC Player settings

When the XC Player starts, the track data is shown on the Hybrid map. You can choose a different map here.

Main Map:
  Use default
Tab settings

The first tab shown when you view a flight is the Flight Map. You can choose a different tab here.

First Tab:
  Use default
Notes

This page uses cookies to save your settings for future visits.

If you have disabled cookies for this site then any changes you make will not be saved.