


| Duration | 0:00 | Takeoff Distance | 0 |
| Height: | metres |
| Climb: | m/sec |
| Speed: | km/h |
| Distance: | km |
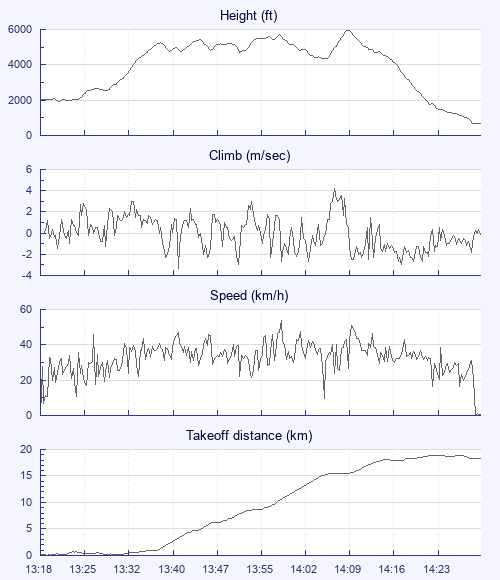
| Height - GPS data | |
| Maximum Height [14:10:15] |
5971 ft |
| Lowest Save [14:06:52] |
4337 ft |
| Takeoff Height [13:18:24] |
2021 ft |
| Landing Height [14:32:22] |
696 ft |
| Total Ascent | 8576 ft |
| Height Gain | |
| Above Takeoff | 3950 ft |
| Maximum | 4045 ft |
| Low Point [13:21:29] |
1926 ft |
| High Point as Maximum Height |
5971 ft |
| Units | |
| Climb - GPS data | |
| Maximum Climb [14:08:12] |
4.2 m/s |
| Minimum Climb [13:41:42] |
-3.3 m/s |
| Units | |
| Speed | |
| Maximum Speed [13:59:38] |
54.0 km/h |
| Average Speed around course |
22.8 km/h |
| Average Speed over track length |
33.3 km/h |
| Units | |
| Tracklog | |
| Flight Duration | 1hr 13mins |
| Track Points | 1486 |
| Recording Interval | 3 secs |
| Statistics Interval | 6 secs |
| Track Length | 41.1 km |
| Units | |
| Flight instrument - reported as | |
| Digifly LEONARDO , 64.50 |
| Height: | |
| Speed: | |
| Climb: | |
| Distance: |
| Main Map: |
| First Tab: |