


| Duration | 0:00 | Takeoff Distance | 0 |
| Height: | metres |
| Climb: | m/sec |
| Speed: | km/h |
| Distance: | km |
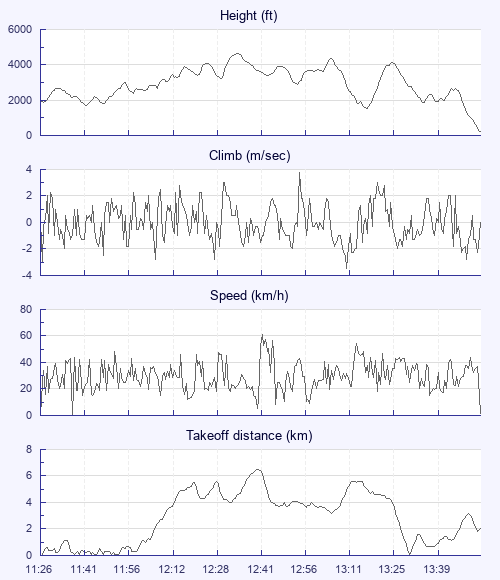
| Height - GPS data | |
| Maximum Height [12:35:24] |
4665 ft |
| Lowest Save [13:16:52] |
1552 ft |
| Takeoff Height [11:26:55] |
1942 ft |
| Landing Height [13:55:00] |
213 ft |
| Total Ascent | 15466 ft |
| Height Gain | |
| Above Takeoff | 2723 ft |
| Maximum | 2989 ft |
| Low Point [11:41:40] |
1677 ft |
| High Point as Maximum Height |
4665 ft |
| Units | |
| Climb - Pressure data | |
| Maximum Climb [12:54:56] |
3.8 m/s |
| Minimum Climb [13:11:16] |
-3.5 m/s |
| Units | |
| Speed | |
| Maximum Speed [12:42:12] |
61.2 km/h |
| Average Speed around course |
10.1 km/h |
| Average Speed over track length |
29.5 km/h |
| Units | |
| Tracklog | |
| Flight Duration | 2hrs 28mins |
| Track Points | 2232 |
| Recording Interval | 4 secs |
| Statistics Interval | 4 secs |
| Track Length | 72.7 km |
| Units | |
| Flight instrument | |
| Type | Oudie 4 |
| Model | Not Set |
| Firmware | 7.11.001 |
| Height: | |
| Speed: | |
| Climb: | |
| Distance: |
| Main Map: |
| First Tab: |