Xc Title
User:Guest
Ozone advert
Rafal Talarek  All flights
Sky Surfing League 2018
Flight type image
Turnpoint Flight on a Paraglider
Club
XC Junkies
Glider
Advance Sigma10
Date
3rd June 2018
Start
13:21
Finish
14:04
Duration
43mins
Takeoff
Pandy
Landing
Nr Crucorney
Coords
Takeoff
51.95525, -3.02225
Start
51.95525, -3.02227
TP1
51.91175, -2.99627
TP2
51.91540, -2.98270
TP3
51.86205, -3.00542
Finish
51.86125, -3.01317
Landing
51.86153, -3.01015
Distances and Score
Leg 1
5.16k
Leg 2
1.02k
Leg 3
6.14k
Leg 4
0.54k
Total
12.86k
Score
12.9
Open Distance
Total
10.5k
Filename
Use full pilot name
Download
Validated
Yes
Flight map
Notes

This map gives an overview of the flight, using the turnpoints to plot the track.

Use the for a detailed map and flight track.

Duration 0:00   Takeoff Distance 0
Controls
To animate the flight: click a point on the track, use the slider, or click the Play button.
slider
slider
Speed
Speed
Slower
Faster
Track color
No data
Highlights
Track data
Time: No data
Height:
Climb:
Speed:
Interval:
Units
Height: metres
Climb: m/sec
Speed: km/h
Distance: km
chart
Notes

Climb and Speed averaged over 4 second intervals.

These values may be lower than those shown by a flight instrument, which has access to continuous raw data.

Metric units are used for all chart data, except for Height which is shown in feet.

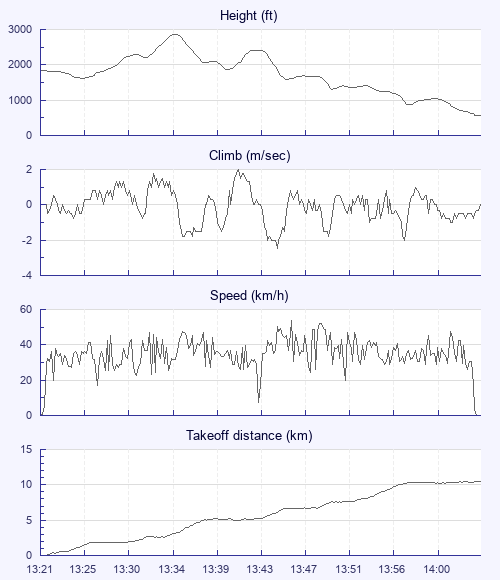
Height   -   Pressure data
Maximum Height
[13:35:18]
2864 ft
Lowest Save
[13:40:37]
1857 ft
Takeoff Height
[13:21:30]
1831 ft
Landing Height
[14:06:13]
554 ft
Total Ascent 2493 ft
Height Gain
Above Takeoff 1033 ft
Maximum 1253 ft
Low Point
[13:25:19]
1611 ft
High Point
as Maximum Height
2864 ft
Units
Climb   -   Pressure data
Maximum Climb
[13:41:45]
2.0 m/s
Minimum Climb
[13:45:25]
-2.5 m/s
Units
Speed
Maximum Speed
[13:46:57]
54.0 km/h
Average Speed
around course
17.8 km/h
Average Speed
over track length
35.0 km/h
Units
Tracklog
Flight Duration 44mins
Track Points 1359
Recording Interval 2 secs
Statistics Interval 4 secs
Track Length 26.1 km
Units
Flight instrument
Type Flyskyhy
Model 6.11
Firmware 6.11
Notes

Climb and Speed averaged over 4 second intervals.

These values may be lower than those shown by a flight instrument, which has access to continuous raw data.

Average Speed around course is measured from Start to Finish points.

Track Length is the cumulative distance between track points from Takeoff to Landing.

You can change the default units displayed - see the Options page.

Use this page to set various display Options. You can choose which units are used to display flight data, which map to show when the starts and which tab to show each time you view a flight.
Units settings

Metric units are used by default for the Statistics and XC Player pages, except for Height data which is shown in feet. You can choose your own custom settings here.

Height:
Speed:
Climb:
Distance:
  Use default
XC Player settings

When the XC Player starts, the track data is shown on the Hybrid map. You can choose a different map here.

Main Map:
  Use default
Tab settings

The first tab shown when you view a flight is the Flight Map. You can choose a different tab here.

First Tab:
  Use default
Notes

This page uses cookies to save your settings for future visits.

If you have disabled cookies for this site then any changes you make will not be saved.