


| Duration | 0:00 | Takeoff Distance | 0 |
| Height: | metres |
| Climb: | m/sec |
| Speed: | km/h |
| Distance: | km |
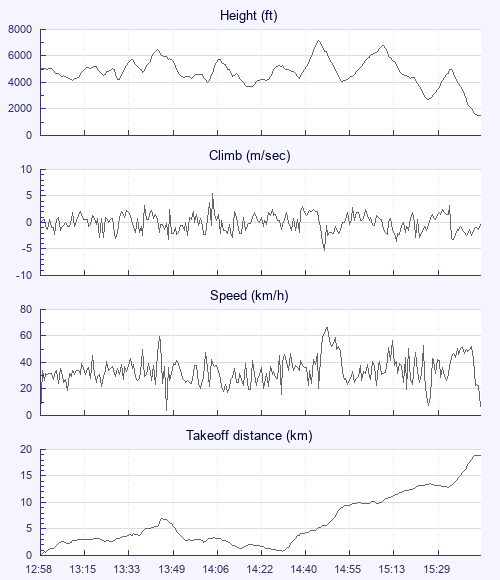
| Height - GPS data | |
| Maximum Height [14:47:42] |
7136 ft |
| Lowest Save [15:29:21] |
2707 ft |
| Takeoff Height [12:58:08] |
5138 ft |
| Landing Height [15:49:20] |
1476 ft |
| Total Ascent | 21621 ft |
| Height Gain | |
| Above Takeoff | 1998 ft |
| Maximum | 3478 ft |
| Low Point [14:20:31] |
3658 ft |
| High Point as Maximum Height |
7136 ft |
| Units | |
| Climb - Pressure data | |
| Maximum Climb [14:06:24] |
5.5 m/s |
| Minimum Climb [14:49:08] |
-5.3 m/s |
| Units | |
| Speed | |
| Maximum Speed [14:49:12] |
66.6 km/h |
| Average Speed around course |
14.1 km/h |
| Average Speed over track length |
34.1 km/h |
| Units | |
| Tracklog | |
| Flight Duration | 2hrs 51mins |
| Track Points | 10186 |
| Recording Interval | 1 secs |
| Statistics Interval | 4 secs |
| Track Length | 97.4 km |
| Units | |
| Flight instrument | |
| Type | Xc_tracer |
| Model | Not Set |
| Firmware | Xc_tracer_v1.0_r05 |
| Height: | |
| Speed: | |
| Climb: | |
| Distance: |
| Main Map: |
| First Tab: |