


| Duration | 0:00 | Takeoff Distance | 0 |
| Height: | metres |
| Climb: | m/sec |
| Speed: | km/h |
| Distance: | km |
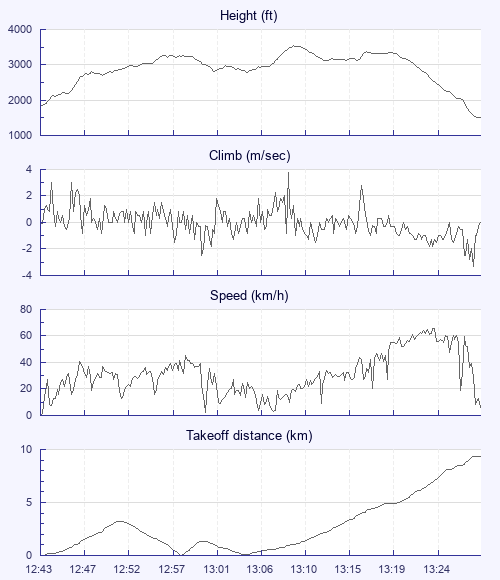
| Height - GPS data | |
| Maximum Height [13:09:43] |
3540 ft |
| Takeoff Height [12:43:11] |
1854 ft |
| Landing Height [13:28:47] |
1499 ft |
| Total Ascent | 3947 ft |
| Height Gain | |
| Above Takeoff | 1686 ft |
| Units | |
| Climb - Pressure data | |
| Maximum Climb [13:09:15] |
3.8 m/s |
| Minimum Climb [13:28:35] |
-3.3 m/s |
| Units | |
| Speed | |
| Maximum Speed [13:24:15] |
65.7 km/h |
| Average Speed around course |
29.3 km/h |
| Average Speed over track length |
32.0 km/h |
| Units | |
| Tracklog | |
| Flight Duration | 45mins |
| Track Points | 2737 |
| Recording Interval | 1 secs |
| Statistics Interval | 4 secs |
| Track Length | 24.3 km |
| Units | |
| Flight instrument | |
| Type | Oudie 4 |
| Model | Not Set |
| Firmware | 8.03.002 |
| Height: | |
| Speed: | |
| Climb: | |
| Distance: |
| Main Map: |
| First Tab: |