Xc Title
User:Guest
Naviter advert
Peter Campbell  All flights
Overseas League 2018
Flight type image
Turnpoint Flight on a Paraglider
Club
Southern
Glider
Niviuk Ikuma
Date
19th July 2018
Start
12:40
Finish
17:19
Duration
4hrs 38mins
Takeoff
Emberger Alm
Landing
Greifenburg
Coords
Takeoff
46.77247, 13.14938
Start
46.78015, 13.16828
TP1
46.78192, 12.95792
TP2
46.71017, 13.27480
TP3
46.71538, 13.12952
Finish
46.74373, 13.20437
Landing
46.74672, 13.19197
Distances and Score
Leg 1
16.07k
Leg 2
25.50k
Leg 3
11.12k
Leg 4
6.53k
Total
59.22k
Score
59.2
Open Distance
Total
25.5k
Filename
Use full pilot name
Download
Validated
No
Flight map
Notes

This map gives an overview of the flight, using the turnpoints to plot the track.

Use the for a detailed map and flight track.

Duration 0:00   Takeoff Distance 0
Controls
To animate the flight: click a point on the track, use the slider, or click the Play button.
slider
slider
Speed
Speed
Slower
Faster
Track color
No data
Highlights
Track data
Time: No data
Height:
Climb:
Speed:
Interval:
Units
Height: metres
Climb: m/sec
Speed: km/h
Distance: km
chart
Notes

Climb and Speed averaged over 4 second intervals.

These values may be lower than those shown by a flight instrument, which has access to continuous raw data.

Metric units are used for all chart data, except for Height which is shown in feet.

Height   -   GPS data
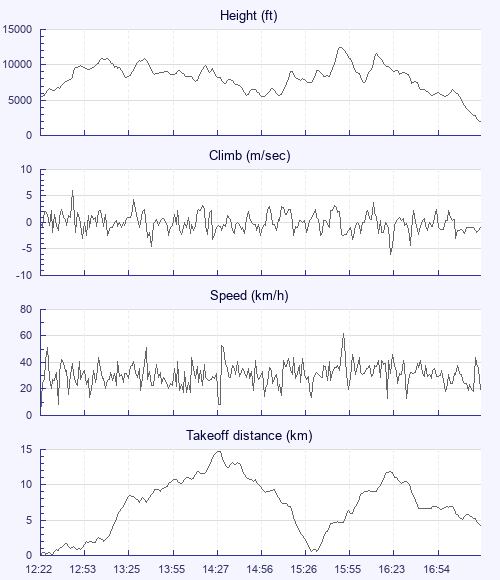
Maximum Height
[15:51:53]
12421 ft
Lowest Save
[14:58:11]
5463 ft
Takeoff Height
[12:22:56]
5692 ft
Landing Height
[17:23:01]
1923 ft
Total Ascent 40308 ft
Height Gain
Above Takeoff 6729 ft
Maximum 6959 ft
Low Point
as Lowest Save
5463 ft
High Point
as Maximum Height
12421 ft
Units
Climb   -   Pressure data
Maximum Climb
[12:44:28]
6.0 m/s
Minimum Climb
[16:23:24]
-6.0 m/s
Units
Speed
Maximum Speed
[15:52:48]
62.1 km/h
Average Speed
around course
12.8 km/h
Average Speed
over track length
31.0 km/h
Units
Tracklog
Flight Duration 5hrs
Track Points 18006
Recording Interval 1 secs
Statistics Interval 4 secs
Track Length 154.9 km
Units
Flight instrument
Type Oudie 4
Model Not Set
Firmware 8.03.002
Notes

Climb and Speed averaged over 4 second intervals.

These values may be lower than those shown by a flight instrument, which has access to continuous raw data.

Average Speed around course is measured from Start to Finish points.

Track Length is the cumulative distance between track points from Takeoff to Landing.

You can change the default units displayed - see the Options page.

Use this page to set various display Options. You can choose which units are used to display flight data, which map to show when the starts and which tab to show each time you view a flight.
Units settings

Metric units are used by default for the Statistics and XC Player pages, except for Height data which is shown in feet. You can choose your own custom settings here.

Height:
Speed:
Climb:
Distance:
  Use default
XC Player settings

When the XC Player starts, the track data is shown on the Hybrid map. You can choose a different map here.

Main Map:
  Use default
Tab settings

The first tab shown when you view a flight is the Flight Map. You can choose a different tab here.

First Tab:
  Use default
Notes

This page uses cookies to save your settings for future visits.

If you have disabled cookies for this site then any changes you make will not be saved.