


| Duration | 0:00 | Takeoff Distance | 0 |
| Height: | metres |
| Climb: | m/sec |
| Speed: | km/h |
| Distance: | km |
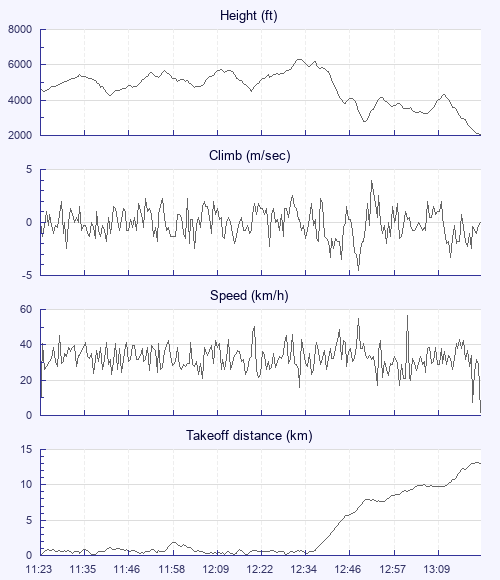
| Height - GPS data | |
| Maximum Height [12:34:08] |
6322 ft |
| Lowest Save [12:52:09] |
2782 ft |
| Takeoff Height [11:23:25] |
4639 ft |
| Landing Height [13:22:09] |
2083 ft |
| Total Ascent | 13084 ft |
| Height Gain | |
| Above Takeoff | 1683 ft |
| Maximum | 2060 ft |
| Low Point [11:41:49] |
4262 ft |
| High Point as Maximum Height |
6322 ft |
| Units | |
| Climb - Pressure data | |
| Maximum Climb [12:53:25] |
4.0 m/s |
| Minimum Climb [12:50:21] |
-4.5 m/s |
| Units | |
| Speed | |
| Maximum Speed [13:02:49] |
56.7 km/h |
| Average Speed around course |
10.4 km/h |
| Average Speed over track length |
32.9 km/h |
| Units | |
| Tracklog | |
| Flight Duration | 1hr 58mins |
| Track Points | 7125 |
| Recording Interval | 1 secs |
| Statistics Interval | 4 secs |
| Track Length | 65.1 km |
| Units | |
| Flight instrument - reported as | |
| Flymaster NavSD SN00444 SW1.07i |
| Height: | |
| Speed: | |
| Climb: | |
| Distance: |
| Main Map: |
| First Tab: |