


| Duration | 0:00 | Takeoff Distance | 0 |
| Height: | metres |
| Climb: | m/sec |
| Speed: | km/h |
| Distance: | km |
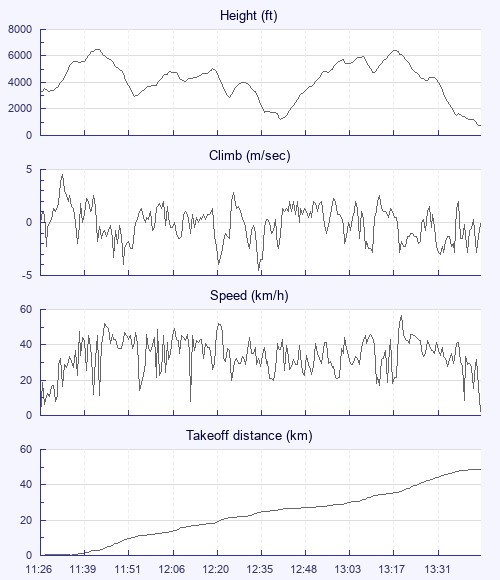
| Height - GPS data | |
| Maximum Height [11:42:07] |
6516 ft |
| Lowest Save [12:41:33] |
1237 ft |
| Takeoff Height [11:26:36] |
3379 ft |
| Landing Height [13:43:29] |
768 ft |
| Total Ascent | 16640 ft |
| Height Gain | |
| Above Takeoff | 3136 ft |
| Maximum | 5207 ft |
| Low Point as Lowest Save |
1237 ft |
| High Point [13:18:48] |
6444 ft |
| Units | |
| Climb - Pressure data | |
| Maximum Climb [11:32:08] |
4.5 m/s |
| Minimum Climb [12:34:24] |
-4.5 m/s |
| Units | |
| Speed | |
| Maximum Speed [13:20:04] |
56.7 km/h |
| Average Speed around course |
22.3 km/h |
| Average Speed over track length |
34.3 km/h |
| Units | |
| Tracklog | |
| Flight Duration | 2hrs 16mins |
| Track Points | 8214 |
| Recording Interval | 1 secs |
| Statistics Interval | 4 secs |
| Track Length | 78.2 km |
| Units | |
| Flight instrument - reported as | |
| SKYTRAXX V1.59 SN:3179839381 |
| Height: | |
| Speed: | |
| Climb: | |
| Distance: |
| Main Map: |
| First Tab: |