


| Duration | 0:00 | Takeoff Distance | 0 |
| Height: | metres |
| Climb: | m/sec |
| Speed: | km/h |
| Distance: | km |
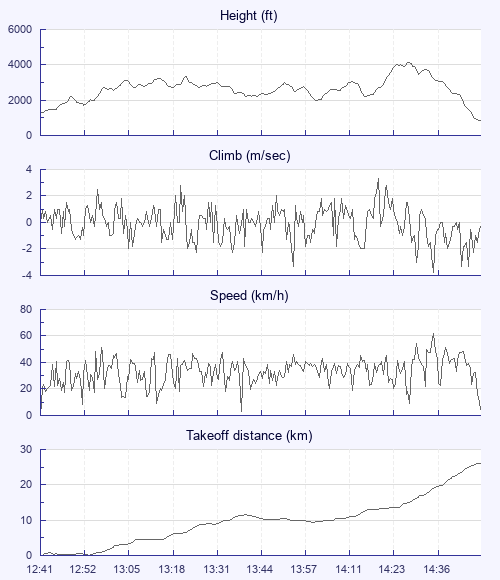
| Height - GPS data | |
| Maximum Height [14:30:00] |
4137 ft |
| Lowest Save [12:52:13] |
1726 ft |
| Takeoff Height [12:41:10] |
1243 ft |
| Landing Height [14:50:28] |
827 ft |
| Total Ascent | 11864 ft |
| Height Gain | |
| Above Takeoff | 2894 ft |
| Maximum | 2913 ft |
| Low Point [12:41:17] |
1224 ft |
| High Point as Maximum Height |
4137 ft |
| Units | |
| Climb - Pressure data | |
| Maximum Climb [14:21:06] |
3.3 m/s |
| Minimum Climb [14:37:02] |
-3.8 m/s |
| Units | |
| Speed | |
| Maximum Speed [14:37:02] |
62.1 km/h |
| Average Speed around course |
18.2 km/h |
| Average Speed over track length |
32.6 km/h |
| Units | |
| Tracklog | |
| Flight Duration | 2hrs 9mins |
| Track Points | 3885 |
| Recording Interval | 2 secs |
| Statistics Interval | 4 secs |
| Track Length | 70.3 km |
| Units | |
| Height: | |
| Speed: | |
| Climb: | |
| Distance: |
| Main Map: |
| First Tab: |