


| Duration | 0:00 | Takeoff Distance | 0 |
| Height: | metres |
| Climb: | m/sec |
| Speed: | km/h |
| Distance: | km |
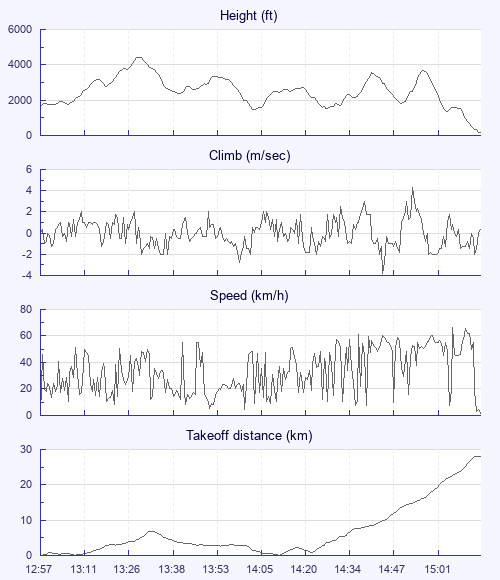
| Height - GPS data | |
| Maximum Height [13:29:43] |
4436 ft |
| Lowest Save [14:03:35] |
1453 ft |
| Takeoff Height [12:57:08] |
1631 ft |
| Landing Height [15:13:46] |
184 ft |
| Total Ascent | 10994 ft |
| Height Gain | |
| Above Takeoff | 2805 ft |
| Units | |
| Climb - Pressure data | |
| Maximum Climb [14:53:22] |
4.3 m/s |
| Minimum Climb [14:44:50] |
-3.8 m/s |
| Units | |
| Speed | |
| Maximum Speed [15:06:18] |
66.6 km/h |
| Average Speed around course |
22.6 km/h |
| Average Speed over track length |
33.5 km/h |
| Units | |
| Tracklog | |
| Flight Duration | 2hrs 16mins |
| Track Points | 4071 |
| Recording Interval | 2 secs |
| Statistics Interval | 4 secs |
| Track Length | 76.2 km |
| Units | |
| Flight instrument | |
| Type | Flytec |
| Model | 6030 |
| Firmware | 3.37 |
| Height: | |
| Speed: | |
| Climb: | |
| Distance: |
| Main Map: |
| First Tab: |