


| Duration | 0:00 | Takeoff Distance | 0 |
| Height: | metres |
| Climb: | m/sec |
| Speed: | km/h |
| Distance: | km |
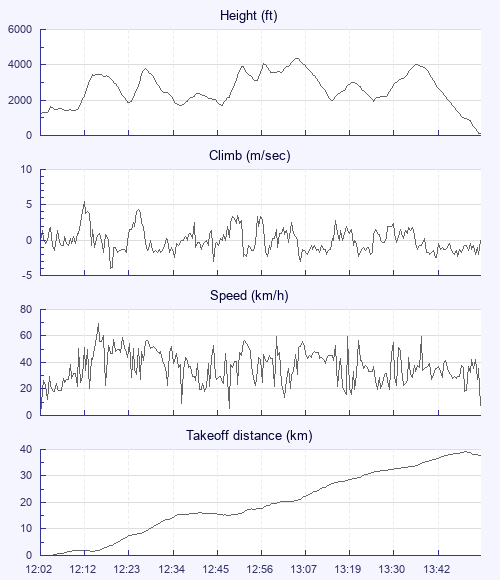
| Height - GPS data | |
| Maximum Height [13:06:19] |
4364 ft |
| Lowest Save [12:37:11] |
1690 ft |
| Takeoff Height [12:02:05] |
1211 ft |
| Landing Height [13:53:46] |
125 ft |
| Total Ascent | 14295 ft |
| Height Gain | |
| Above Takeoff | 3153 ft |
| Maximum | 3169 ft |
| Low Point [12:02:19] |
1194 ft |
| High Point as Maximum Height |
4364 ft |
| Units | |
| Climb - Pressure data | |
| Maximum Climb [12:12:29] |
5.5 m/s |
| Minimum Climb [12:18:45] |
-4.0 m/s |
| Units | |
| Speed | |
| Maximum Speed [12:15:49] |
69.3 km/h |
| Average Speed around course |
24.8 km/h |
| Average Speed over track length |
37.7 km/h |
| Units | |
| Tracklog | |
| Flight Duration | 1hr 51mins |
| Track Points | 6702 |
| Recording Interval | 1 secs |
| Statistics Interval | 4 secs |
| Track Length | 70.2 km |
| Units | |
| Flight instrument | |
| Type | Syride |
| Model | Sys'Nav |
| Firmware | 3.27 |
| Height: | |
| Speed: | |
| Climb: | |
| Distance: |
| Main Map: |
| First Tab: |