Xc Title
User:Guest
Ozone advert
Paul Snell  All flights
National League 2018
Flight type image
Turnpoint Flight on a Paraglider
Club
Armed Forces
Glider
Advance Sigma 10
Date
20th April 2018
Start
13:02
Finish
15:01
Duration
1hr 58mins
Takeoff
Bradwell
Landing
Nr Baslow
Coords
Takeoff
53.32118, -1.73025
Start
53.30198, -1.73598
TP1
53.33018, -1.72617
TP2
53.30155, -1.73517
TP3
53.32900, -1.72953
Finish
53.23923, -1.61073
Landing
53.24000, -1.61198
Distances and Score
Leg 1
3.21k
Leg 2
3.24k
Leg 3
3.08k
Leg 4
12.75k
Total
22.28k
Score
22.3
Open Distance
Total
12.9k
Filename
Use full pilot name
Download
Validated
Yes
Flight map
Notes

This map gives an overview of the flight, using the turnpoints to plot the track.

Use the for a detailed map and flight track.

Duration 0:00   Takeoff Distance 0
Controls
To animate the flight: click a point on the track, use the slider, or click the Play button.
slider
slider
Speed
Speed
Slower
Faster
Track color
No data
Highlights
Track data
Time: No data
Height:
Climb:
Speed:
Interval:
Units
Height: metres
Climb: m/sec
Speed: km/h
Distance: km
chart
Notes

Climb and Speed averaged over 4 second intervals.

These values may be lower than those shown by a flight instrument, which has access to continuous raw data.

Metric units are used for all chart data, except for Height which is shown in feet.

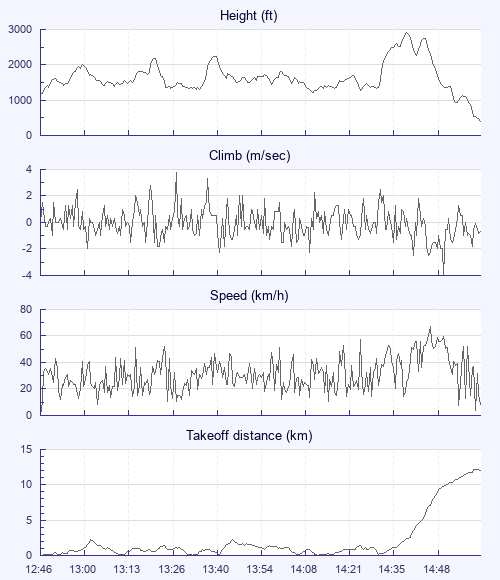
Height   -   Pressure data
Maximum Height
[14:41:11]
2904 ft
Lowest Save
[14:10:48]
1217 ft
Takeoff Height
[12:46:46]
1194 ft
Landing Height
[15:01:54]
387 ft
Total Ascent 11106 ft
Height Gain
Above Takeoff 1709 ft
Maximum 1732 ft
Low Point
[12:46:59]
1171 ft
High Point
as Maximum Height
2904 ft
Units
Climb   -   Pressure data
Maximum Climb
[13:27:48]
3.8 m/s
Minimum Climb
[14:51:47]
-4.0 m/s
Units
Speed
Maximum Speed
[14:48:32]
67.5 km/h
Average Speed
around course
11.3 km/h
Average Speed
over track length
31.0 km/h
Units
Tracklog
Flight Duration 2hrs 15mins
Track Points 4492
Recording Interval 2 secs
Statistics Interval 4 secs
Track Length 69.8 km
Units
Flight instrument
Type Flyskyhy
Model 6.9
Firmware 6.9
Notes

Climb and Speed averaged over 4 second intervals.

These values may be lower than those shown by a flight instrument, which has access to continuous raw data.

Average Speed around course is measured from Start to Finish points.

Track Length is the cumulative distance between track points from Takeoff to Landing.

You can change the default units displayed - see the Options page.

Use this page to set various display Options. You can choose which units are used to display flight data, which map to show when the starts and which tab to show each time you view a flight.
Units settings

Metric units are used by default for the Statistics and XC Player pages, except for Height data which is shown in feet. You can choose your own custom settings here.

Height:
Speed:
Climb:
Distance:
  Use default
XC Player settings

When the XC Player starts, the track data is shown on the Hybrid map. You can choose a different map here.

Main Map:
  Use default
Tab settings

The first tab shown when you view a flight is the Flight Map. You can choose a different tab here.

First Tab:
  Use default
Notes

This page uses cookies to save your settings for future visits.

If you have disabled cookies for this site then any changes you make will not be saved.