Xc Title
User:Guest
UK Airsports advert
Rosie Darwood  All flights
Dales PG League 2019
Flight type image
Turnpoint Flight on a Paraglider
Club
Dales
Glider
Ozone Rush 5
Date
21st April 2019
Start
11:52
Finish
15:57
Duration
4hrs 5mins
Takeoff
Staggs Fell
Landing
Nr Steel
Coords
Takeoff
54.33010, -2.20172
Start
54.33010, -2.20172
TP1
54.32172, -2.18233
TP2
54.32882, -2.19777
TP3
54.31978, -2.19722
Finish
54.85763, -2.16608
Landing
54.85763, -2.16608
Distances and Score
Leg 1
1.57k
Leg 2
1.28k
Leg 3
1.01k
Leg 4
59.91k
Total
63.77k
Score
63.8
Open Distance
Total
59.9k
Filename
Use full pilot name
Download
Validated
Yes
Flight map
Notes

This map gives an overview of the flight, using the turnpoints to plot the track.

Use the for a detailed map and flight track.

Duration 0:00   Takeoff Distance 0
Controls
To animate the flight: click a point on the track, use the slider, or click the Play button.
slider
slider
Speed
Speed
Slower
Faster
Track color
No data
Highlights
Track data
Time: No data
Height:
Climb:
Speed:
Interval:
Units
Height: metres
Climb: m/sec
Speed: km/h
Distance: km
chart
Notes

Climb and Speed averaged over 5 second intervals.

These values may be lower than those shown by a flight instrument, which has access to continuous raw data.

Red values indicate suspect data, because the tracklog contains invalid points.

Metric units are used for all chart data, except for Height which is shown in feet.

Height   -   GPS data
Maximum Height
[15:16:34]
5968 ft
Lowest Save
[12:54:54]
1709 ft
Takeoff Height
[11:52:26]
1581 ft
Landing Height
[16:27:29]
4511 ft
Total Ascent 18980 ft
Height Gain
Above Takeoff 4386 ft
Units
Climb   -   Pressure data
Maximum Climb
[14:18:49]
3.4 m/s
Minimum Climb
[15:44:34]
-4.0 m/s
Units
Speed
Maximum Speed
[15:25:44]
69.8 km/h
Average Speed
around course
15.6 km/h
Average Speed
over track length
26.0 km/h
Units
Tracklog
Flight Duration 4hrs 35mins
Track Points 3297
Recording Interval 5 secs
Statistics Interval 5 secs
Track Length 119.2 km
Invalid Positions
[< 1%]
1
Units
Flight instrument
Type Flytec
Model 6015
Firmware 1.3.07 Eng
Notes

Climb and Speed averaged over 5 second intervals.

These values may be lower than those shown by a flight instrument, which has access to continuous raw data.

Red values indicate suspect data, because the tracklog contains invalid points.

Average Speed around course is measured from Start to Finish points.

Track Length is the cumulative distance between track points from Takeoff to Landing.

You can change the default units displayed - see the Options page.

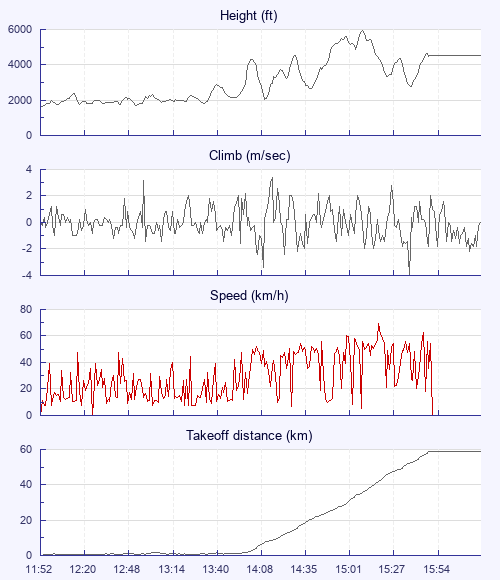
Windy on launch and when thermals finally started coming through they were quite rough, took a long time to get high. Left the hill with 3 others but rapidly ended up alone. Moors worked consistently well - unlike my flytec which seems to have randomly stopped recording (and displaying groundspeed and wind parameters) mid flight. Landed at Newbrough (just West of Hexham) shortly afterwards.

Use this page to set various display Options. You can choose which units are used to display flight data, which map to show when the starts and which tab to show each time you view a flight.
Units settings

Metric units are used by default for the Statistics and XC Player pages, except for Height data which is shown in feet. You can choose your own custom settings here.

Height:
Speed:
Climb:
Distance:
  Use default
XC Player settings

When the XC Player starts, the track data is shown on the Hybrid map. You can choose a different map here.

Main Map:
  Use default
Tab settings

The first tab shown when you view a flight is the Flight Map. You can choose a different tab here.

First Tab:
  Use default
Notes

This page uses cookies to save your settings for future visits.

If you have disabled cookies for this site then any changes you make will not be saved.